
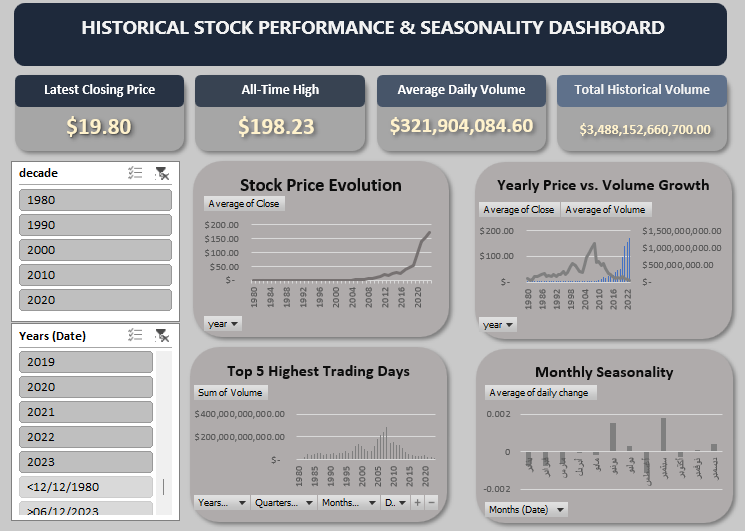

Stock Market Data & Interactive Dashboard
On Sale
$1.00
$1.00
📊 Universal Stock Historical Analysis & Dashboard Template
Unlock comprehensive financial insights into historical stock performance with this professional Excel dashboard template. Engineered for clarity and depth, this tool helps you analyze decades of market data, price trends, and trading volumes for any stock without building complex formulas from scratch.
✨ Key Features:
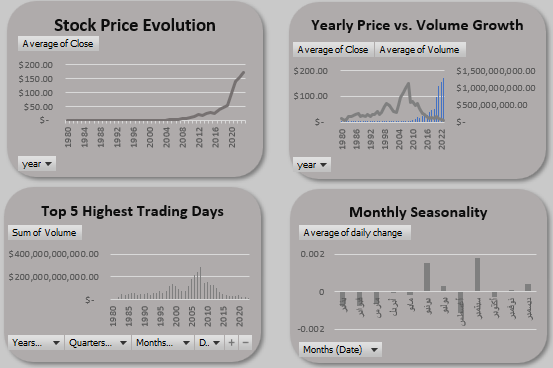
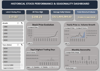
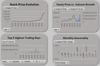
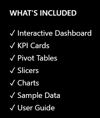
- Interactive Visual Dashboard: Seamlessly track price movements, volume distributions, and key performance indicators (KPIs) through clean, presentation-ready charts.
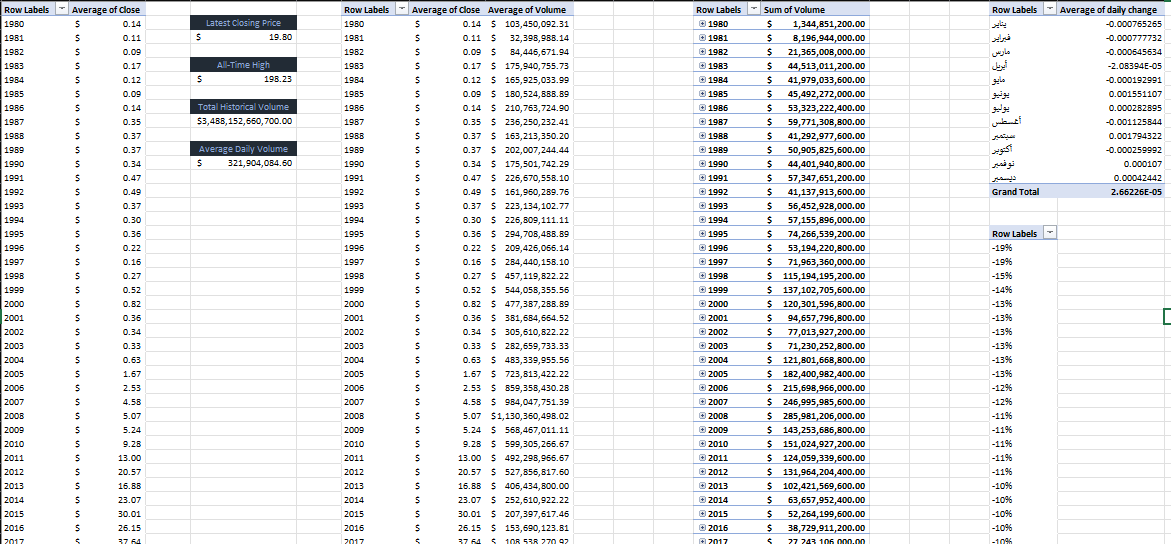
- Automated Pivot Tables: Access pre-configured analytical models covering annual average prices, historical all-time highs, and total trading volumes.
- Multi-Timeframe Breakdown: Effortlessly filter and analyze historical trends by month, year, or decade with integrated slicers.
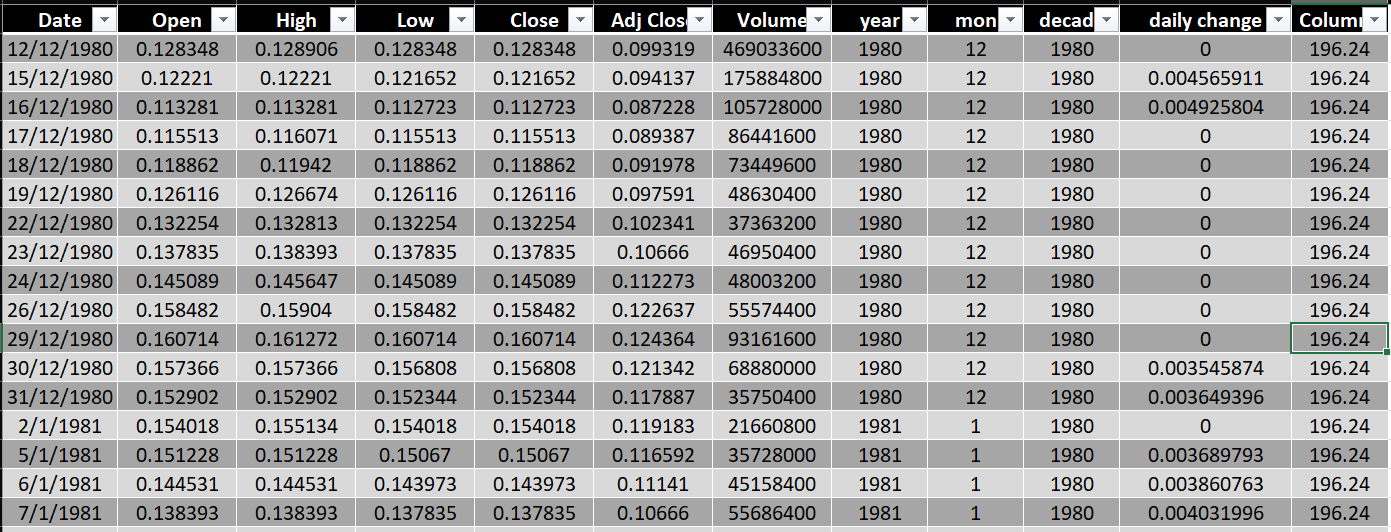
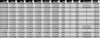
- Clean & Formatted Data: Pre-cleaned historical dataset with standardized currency, number formatting, and optimized structures for immediate use.
🎯 Who Is This For?
- Finance & Economics Students: Ideal for academic research, coursework, and financial modeling practice.
- Retail Investors & Traders: Perfect for analyzing long-term historical trends and seasonal patterns.
- Excel Learners & Analysts: A great reference template for learning pivot tables, slicers, and dashboard architecture.
📦 What You’ll Get:
- 1 x Excel File (.xlsx) containing the cleaned dataset, pre-built pivot tables, and the interactive dashboard.
- 1 x Quick-Start Guide explaining how to navigate, customize, and update the template with fresh data for any ticker.