

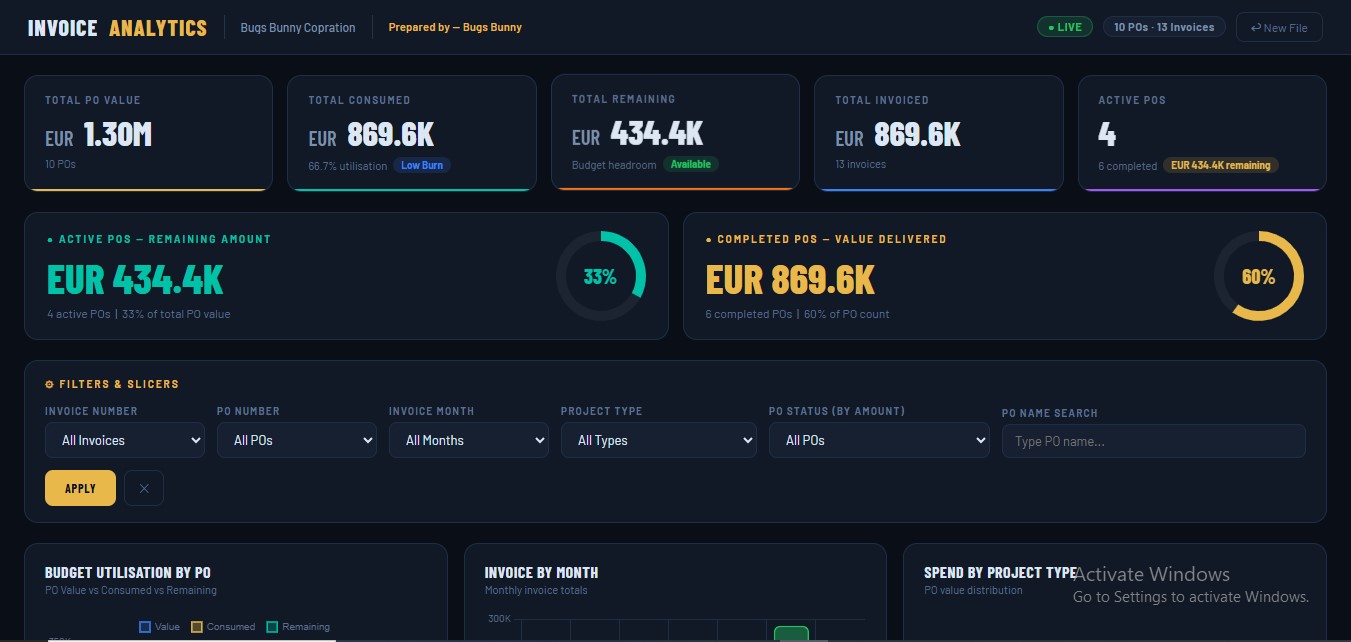
Invoice & PO Analytics Dashboard — Excel Upload, KPI Cards & Charts | HTML Tool for Project Controls Engineers
Chasing invoice status in a spreadsheet is a full-time job. This dashboard changes that.
The Invoice & PO Analytics Dashboard is a single HTML file that transforms your Excel invoice and purchase order data into a live, filterable analytics view — instantly, in your browser, with no software installation, no subscriptions, and no IT department required.
Built by a project controls engineer with 7+ years of experience on Saudi Aramco and GCC EPC projects, this tool was designed for real-world procurement and cost control environments where data visibility matters on a daily basis.
What you get:
5 KPI cards: Total PO value, consumed amount, remaining budget, invoice count, and overall PO utilisation — all calculated automatically from your uploaded data.
6 interactive charts:
- PO Budget vs Consumed vs Remaining (grouped bar)
- Invoice amount by month (trend bar chart)
- Spend by PO type — Maintenance, Manpower, Coating, VLSFO, and more (doughnut chart)
- PO value vs total invoice gap analysis
- Active POs ranked by remaining budget
- Individual invoice amounts by PO
Advanced filter bar: Filter your entire dashboard by PO number, PO type, invoice month range, and keyword search — all charts and tables update instantly.
Full PO table: Every PO with value, consumed, remaining, utilisation progress bar, and status tags (Active / High Burn / Critical / Completed).
Full invoice table: Every invoice line with PO reference, month, amount, SES number, and remarks.
Setup form: Enter your company name, project name, and currency before loading — the dashboard personalises itself and displays your branding in the header.
How it works:
1. Open the HTML file in Chrome, Edge, or Firefox
2. Fill in your company/project details
3. Upload your Excel file (two sheets: one for POs, one for invoices)
4. Your full dashboard loads instantly — no formulas to fix, no pivot tables to refresh
Who this is for:
Project controls engineers, cost engineers, finance coordinators, and contract administrators managing multi-PO scopes on oil & gas, construction, or EPC projects. Especially useful for teams working under Saudi Aramco, ADNOC, Aramco JV, or similar operator contract structures.
What you receive:
One .html file, fully self-contained. Works offline. No macros. No plugins. Compatible with Chrome, Edge, and Firefox. An Excel template with the correct sheet structure is included so you can load your data immediately.
One purchase. Use it on every project.
Questions? Message me through Payhip and I'll reply within 24 hours.