






Crypto Leverage Explained — Measured (PDF Guide)
You were told leverage is a tool, that it cuts both ways, and to use it responsibly. Nobody put a number on any of that. So you picked a multiplier because it sounded moderate, and found out what it meant the first time an ordinary Tuesday went against you.
This guide takes the arithmetic every exchange runs and applies it to 88,000 bars of real market history on ten instruments, at four leverages, from every hour as an entry. 87,840 positions per leverage. The result is a table you can read your own multiplier off, and it is not a forecast -- the liquidation price is computable before you enter, so the only question counted here is how often price got there. This is a 44-page PDF that teaches Crypto Leverage from the first thing you see on the screen through to a written strategy with an entry, a stop and an explicit rule for when the trade is wrong.
Nothing is taught underneath a chart. Every label sits on the candle, the line or the level it is describing, on real BTC, ETH, SOL and LINK charts. There are three quizzes on real charts, each followed by the same chart re-shown annotated with the reasoning, plus faded practice pages where the first steps are filled in and you finish the rest.
WHAT'S INSIDE
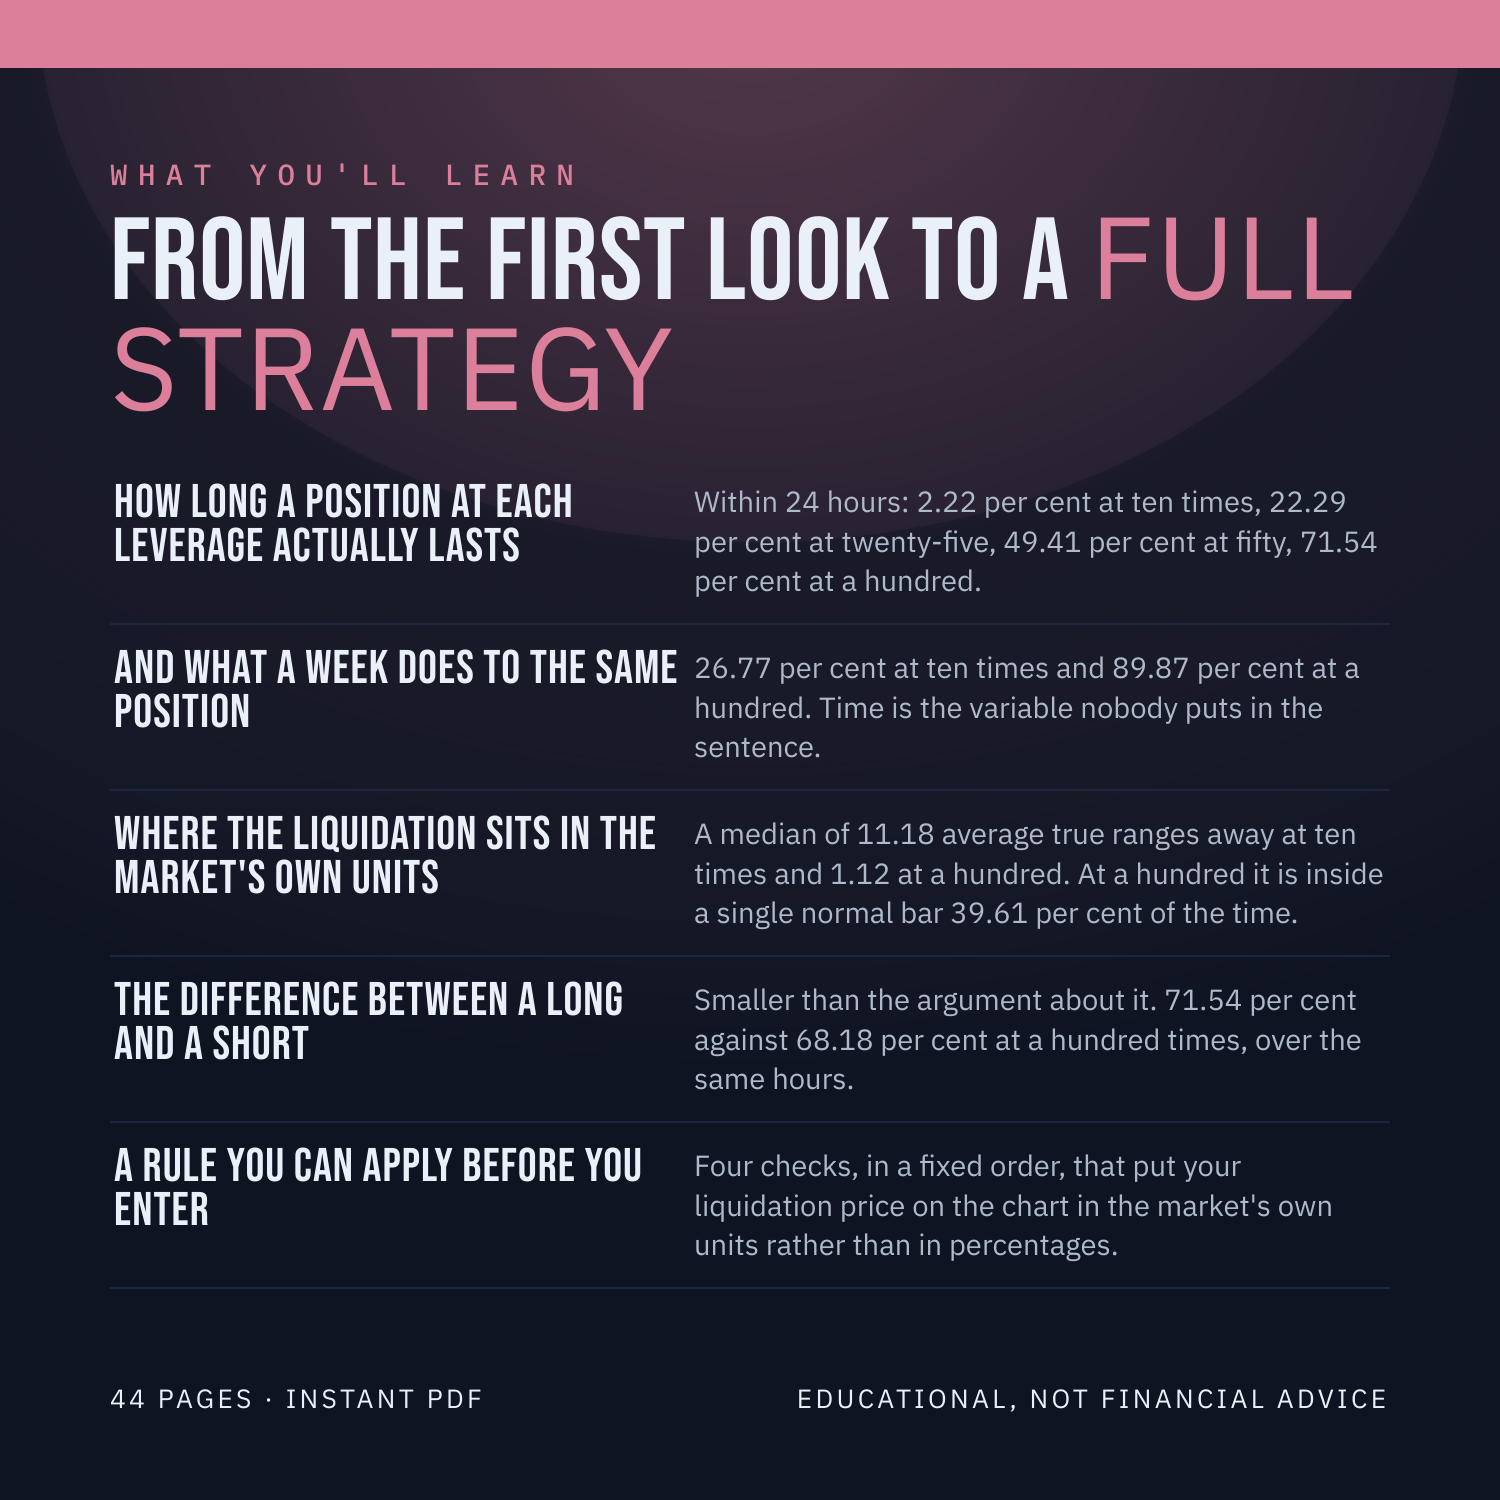
How long a position at each leverage actually lasts -- Within 24 hours: 2.22 per cent at ten times, 22.29 per cent at twenty-five, 49.41 per cent at fifty, 71.54 per cent at a hundred.
And what a week does to the same position -- 26.77 per cent at ten times and 89.87 per cent at a hundred. Time is the variable nobody puts in the sentence.
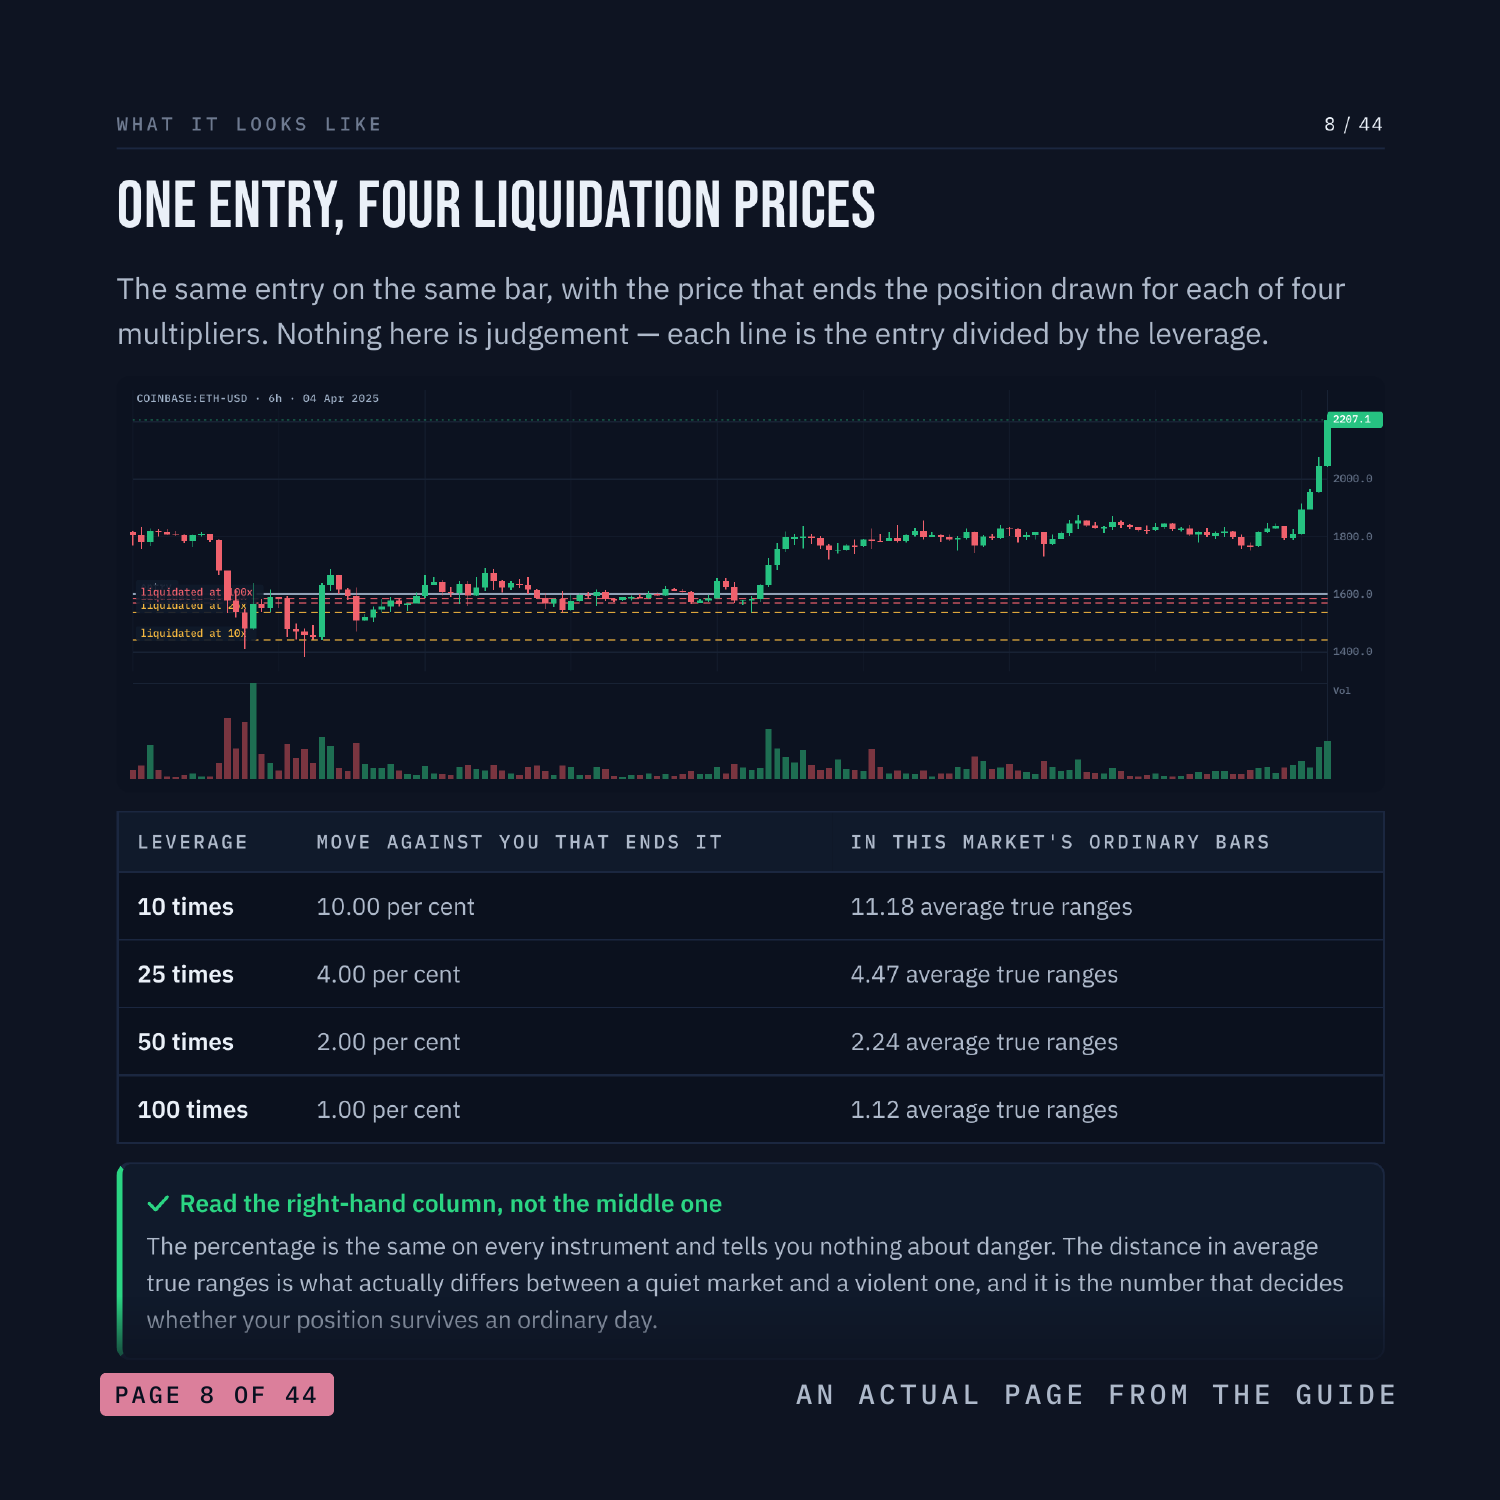
Where the liquidation sits in the market's own units -- A median of 11.18 average true ranges away at ten times and 1.12 at a hundred. At a hundred it is inside a single normal bar 39.61 per cent of the time.
The difference between a long and a short -- Smaller than the argument about it. 71.54 per cent against 68.18 per cent at a hundred times, over the same hours.
A rule you can apply before you enter -- Four checks, in a fixed order, that put your liquidation price on the chart in the market's own units rather than in percentages.
WHAT YOU'LL BE ABLE TO DO
Compute your liquidation price before you enter, in one line.
State that distance in average true ranges, not per cent.
Say how often a position at your leverage survives a day and a week.
Tell the arithmetic of leverage from a claim about direction.
Recognise the leverage at which normal noise is fatal.
AN HONEST NOTE
Crypto Leverage is a clue, not a crystal ball. It describes what price has already done. This guide contains no win-rates, no backtest results and no promises about what you will make, because nobody can verify those and you should not trust anyone who prints them. What it hands you instead is a set of rules you can test yourself on TradingView in an afternoon. Educational, not financial advice.
Instant download. 44 pages, PDF.