
Background
The whole idea behind developing this ThinkorSwim-based Indicator was to create a systematic approach towards Trading.
As both Ainee and myself trade Full-time, we did not want to be in a position to analyze charts every hour of every day before we take a trade. That approach becomes too emotional and leads to self-destructive behavior. Therefore, we wanted something that was not too lagging in nature, and did not take its input from the underlying chart of /NQ, but took lead from the individual components that make up the NASDAQ Index.
Trading Approach.........
Important Stuff !!
No Indicator or Strategy will produce Positive results on its own. Read it Twice and Absorb it. It is a combination of following a Trading approach that has Positive Expectancy along with a Stop-loss and Target that is based on your Risk profile, and Trading goals. Market does not care where you and I enter, or exit. Even if we enter at the same level, our results will vary due to where we exit, how we place our stop, do we trail or not.
To achieve consistent results in Trading, you need a Process that has a high probability of success over X number of Trades. Therefore take a Statistical approach towards Trading and Keep the Risk to Reward in your favor. Results will Follow.
A brief Introduction........
What is Included?
-
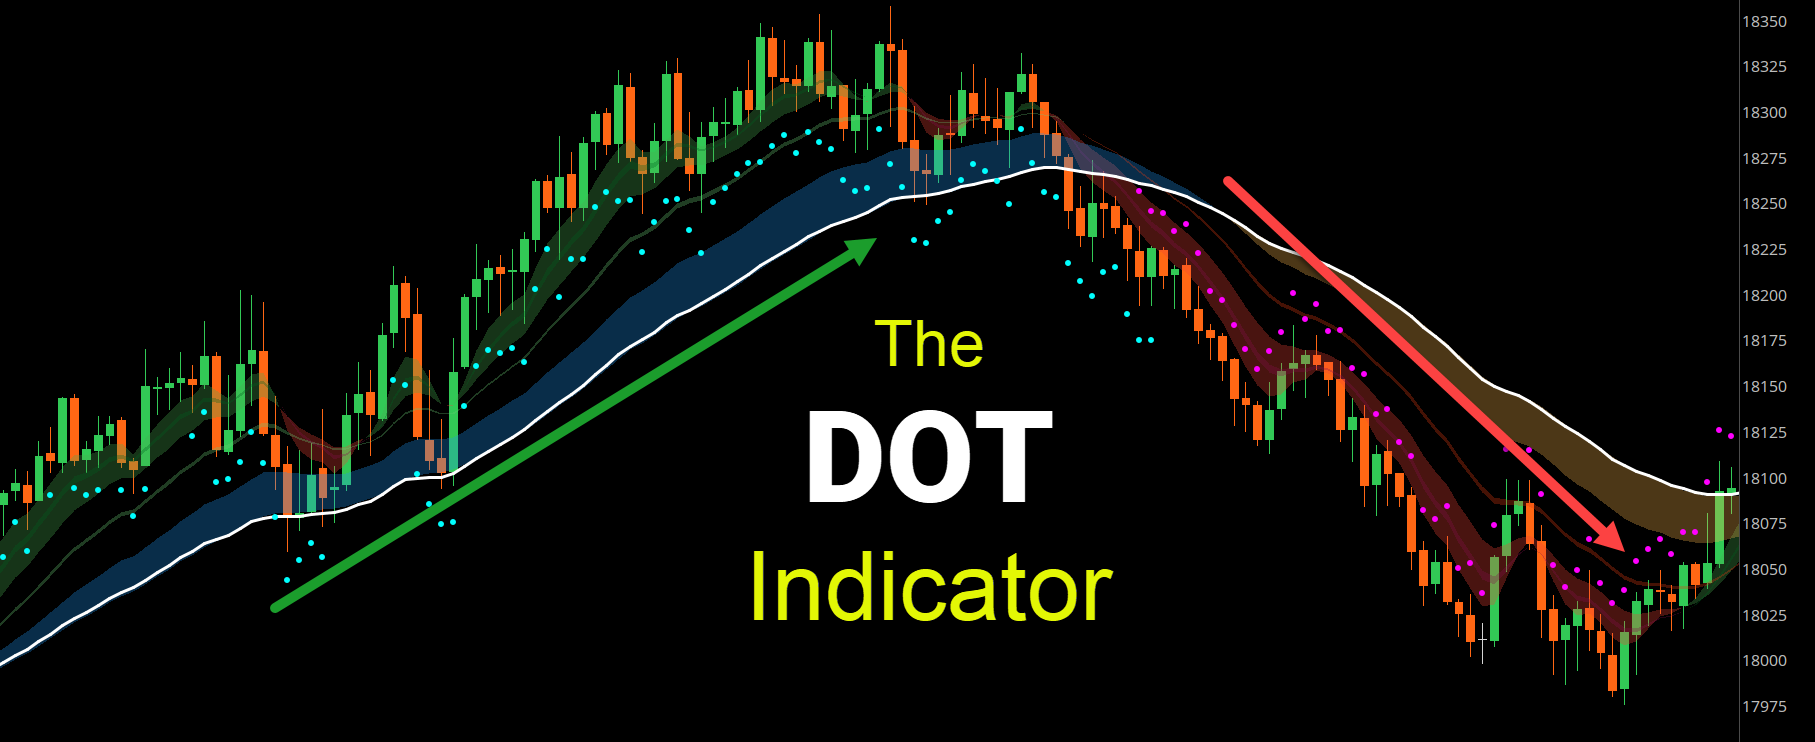
The DOT Indicator
-
Background Details
-
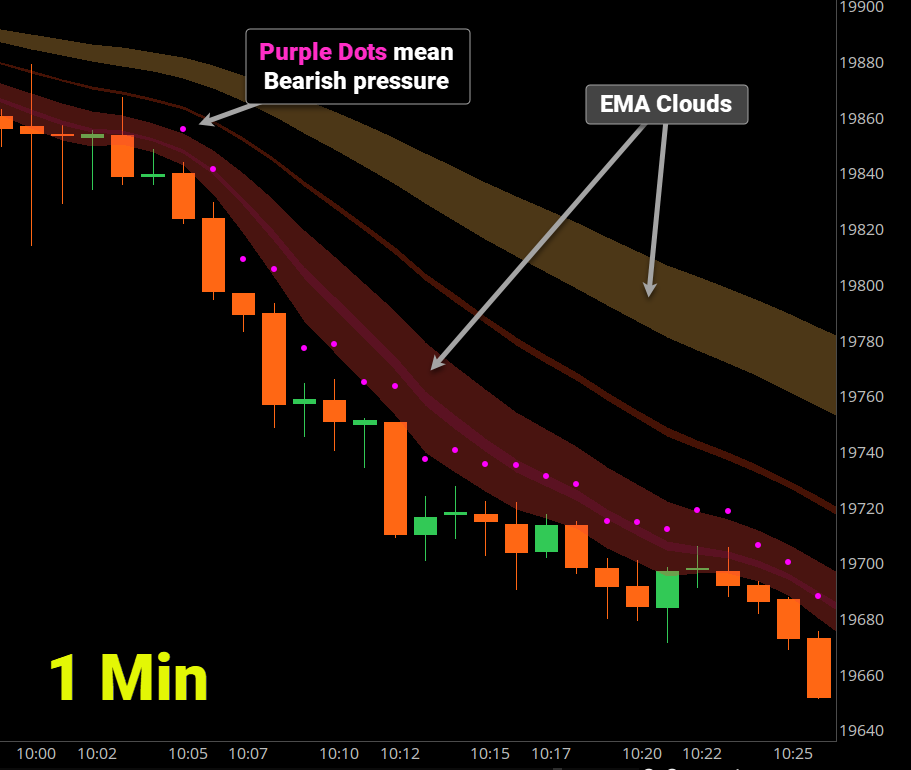
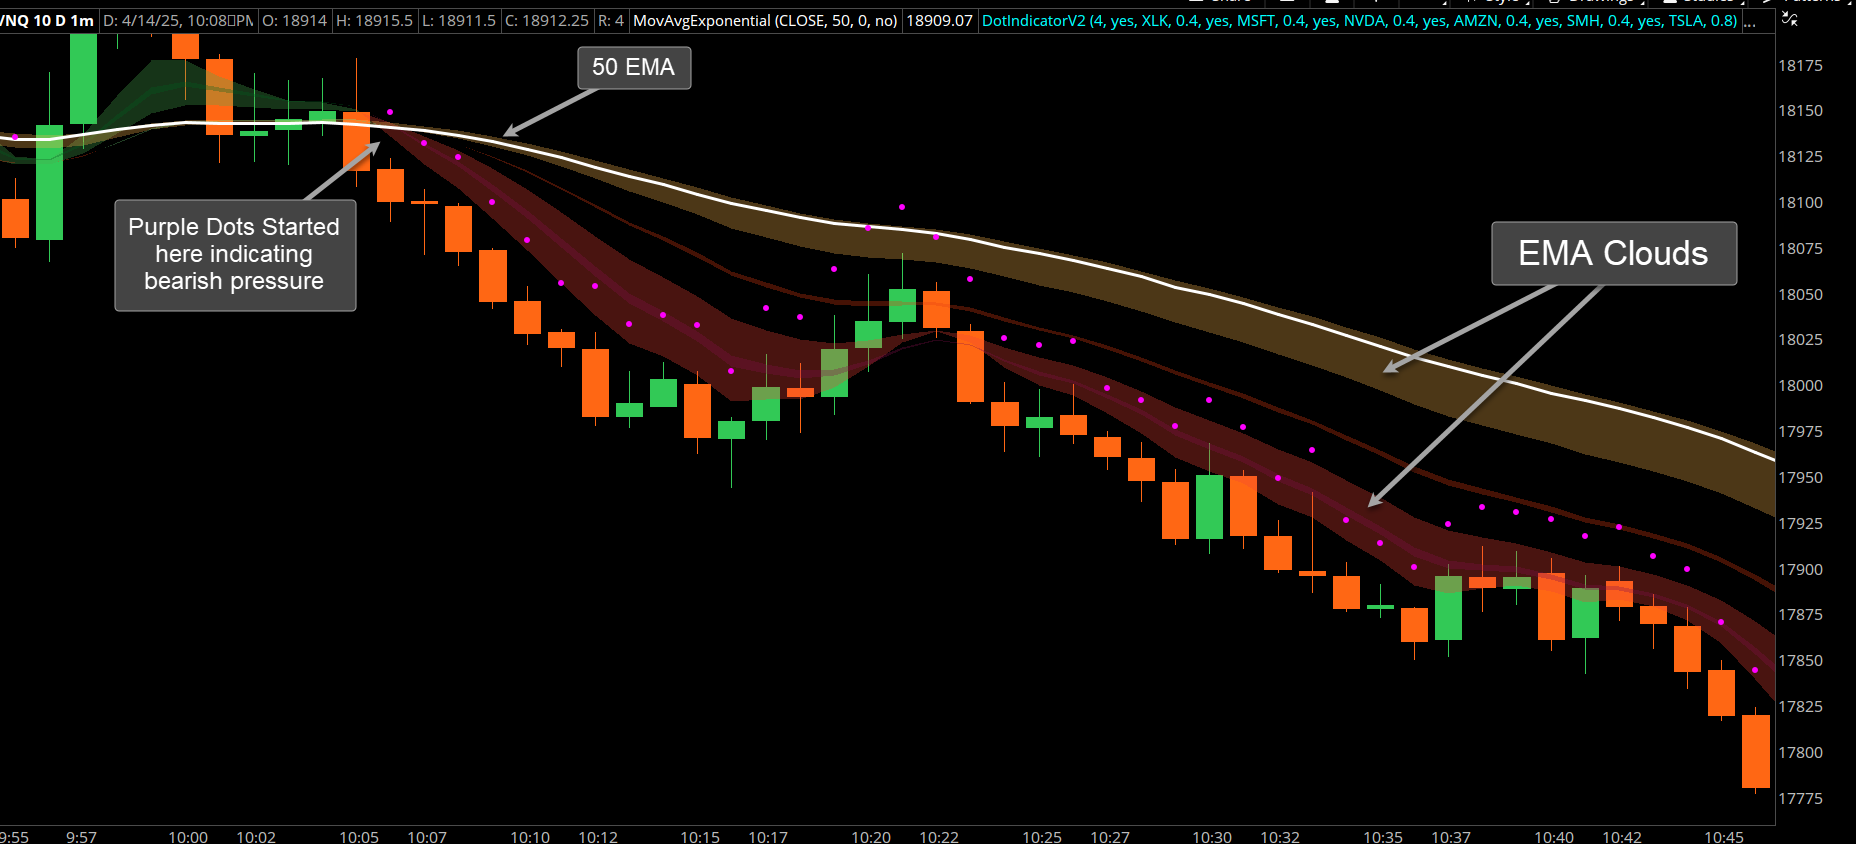
What does the Dot Indicator Show?
-
Going over the Dot Indicator in Detail
-
Download the Dot Indicator for ThinkorSwim
-
Download the EMA Clouds for ThinkorSwim
-
How we Trade with the Dot Indicator?
-
Detailed Video on taking Trade Entries based on Dots
-
Daily Trades
-
The Dot Trading System
$569
You will Get:-
1) The Background Information.
2) What does the Dot Indicator Show?
3) Going over the Dot Indicator in Detail.
4) Download section with Instructions.
5) How I Trade with the Dot Indicator?
6) Link to Daily Trade records.
7) EMA Clouds for additional context.
1) The Background Information.
2) What does the Dot Indicator Show?
3) Going over the Dot Indicator in Detail.
4) Download section with Instructions.
5) How I Trade with the Dot Indicator?
6) Link to Daily Trade records.
7) EMA Clouds for additional context.
The Dot Trading System + 90 Min of Consulting with UC
$769
You will Get:-
1) The Background Information.
2) What does the Dot Indicator Show?
3) Going over the Dot Indicator in Detail.
4) Download section with Instructions.
5) How I Trade with the Dot Indicator?
6) Link to Daily Trade records.
7) EMA Clouds for additional context.
8) Personalized approach to taking the best entries (60 to 90 min of 1:1 Zoom session to help you in identifying the best entries, any back-testing, screen setup etc.)