Simple and Easy Gantt Spreadsheet
What is a Gantt Chart?
A Gantt chart is a tool for project management developed by Henry Gantt in the early 1900s. It uses horizontal bars to show the periods of time when each task or resource has been scheduled. It may also show the portion of work completed, task dependencies, milestones, and other data.
A vast number of software applications have been developed for project management, and most of these use a Gantt chart to visualize the project schedule. However, if you don't need all the bells and whistles of these applications, a spreadsheet can be a simple solution.
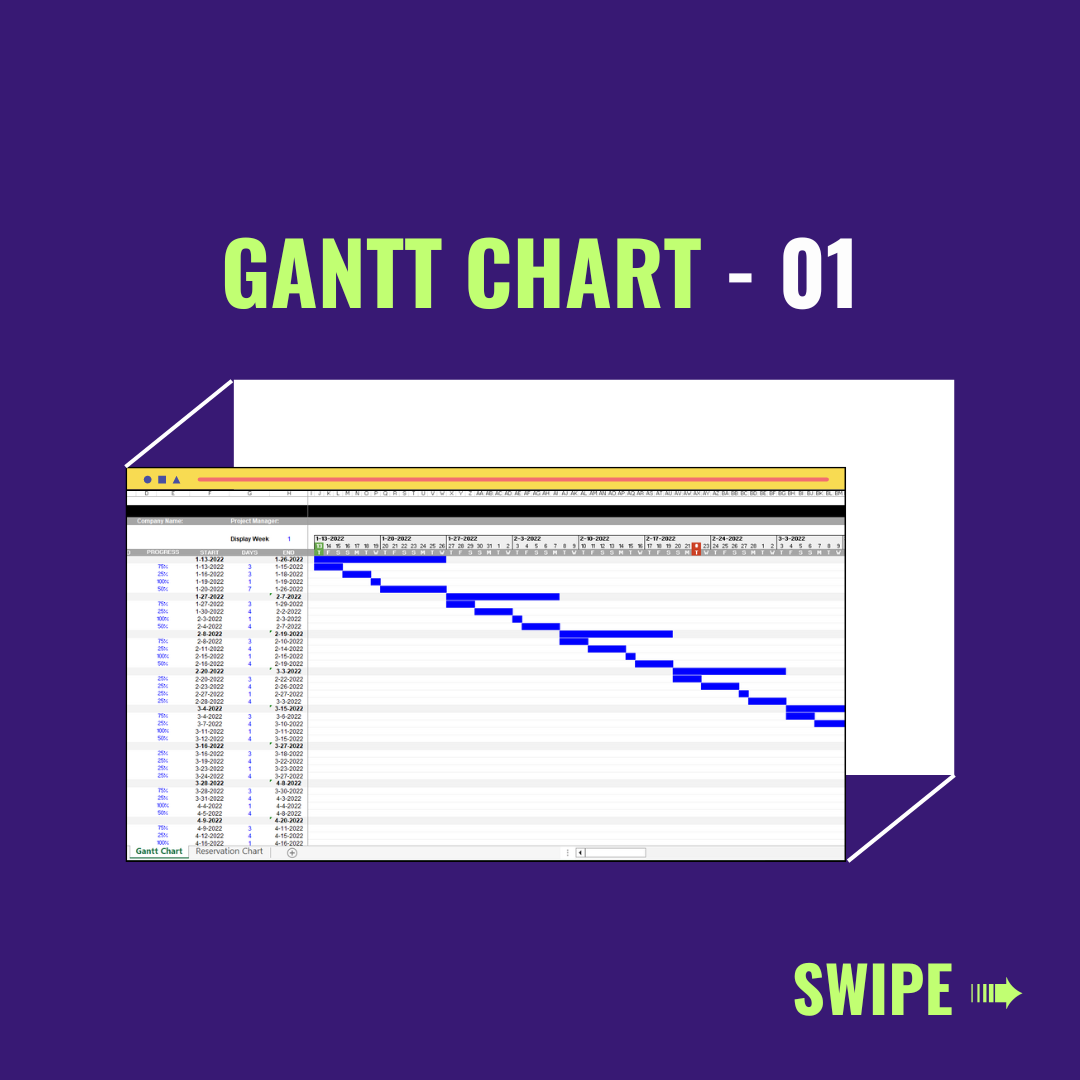
Have you ever tried to organize your projects with a Gantt chart but gave up because it was too complicated? Our SIMPLE AND EASY Gantt Chart offers five different Gantt chart options for various applications. Track not just task progress, but also its deadlines, completion status, and delays. You can monitor project tasks across different periods and schedules, track stages and subtasks, and set your preferred view, whether daily, weekly, or monthly.


