

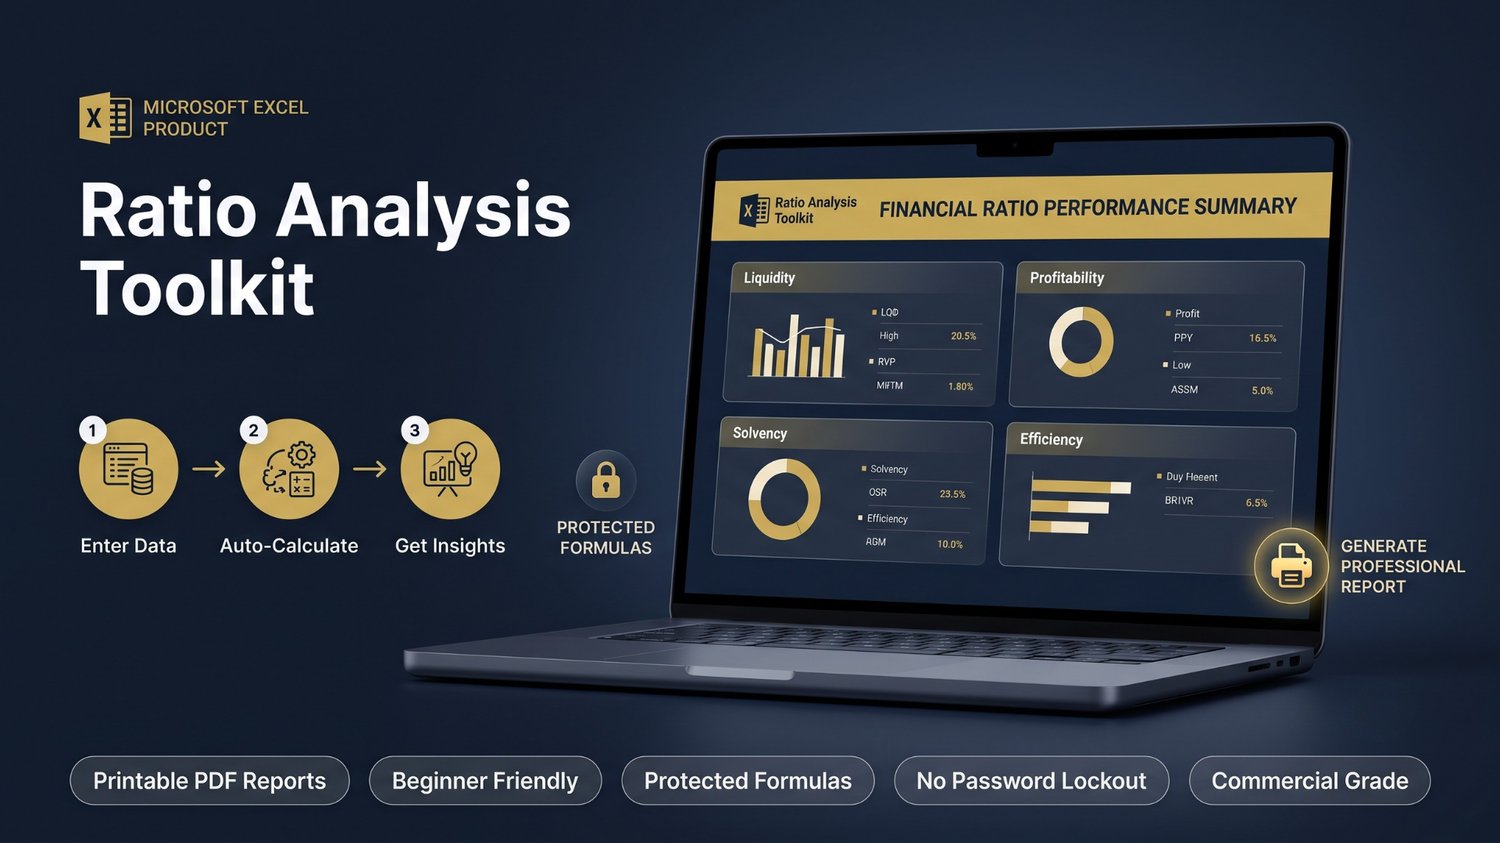





Ratio Analysis Toolkit — Premium Excel Financial Template
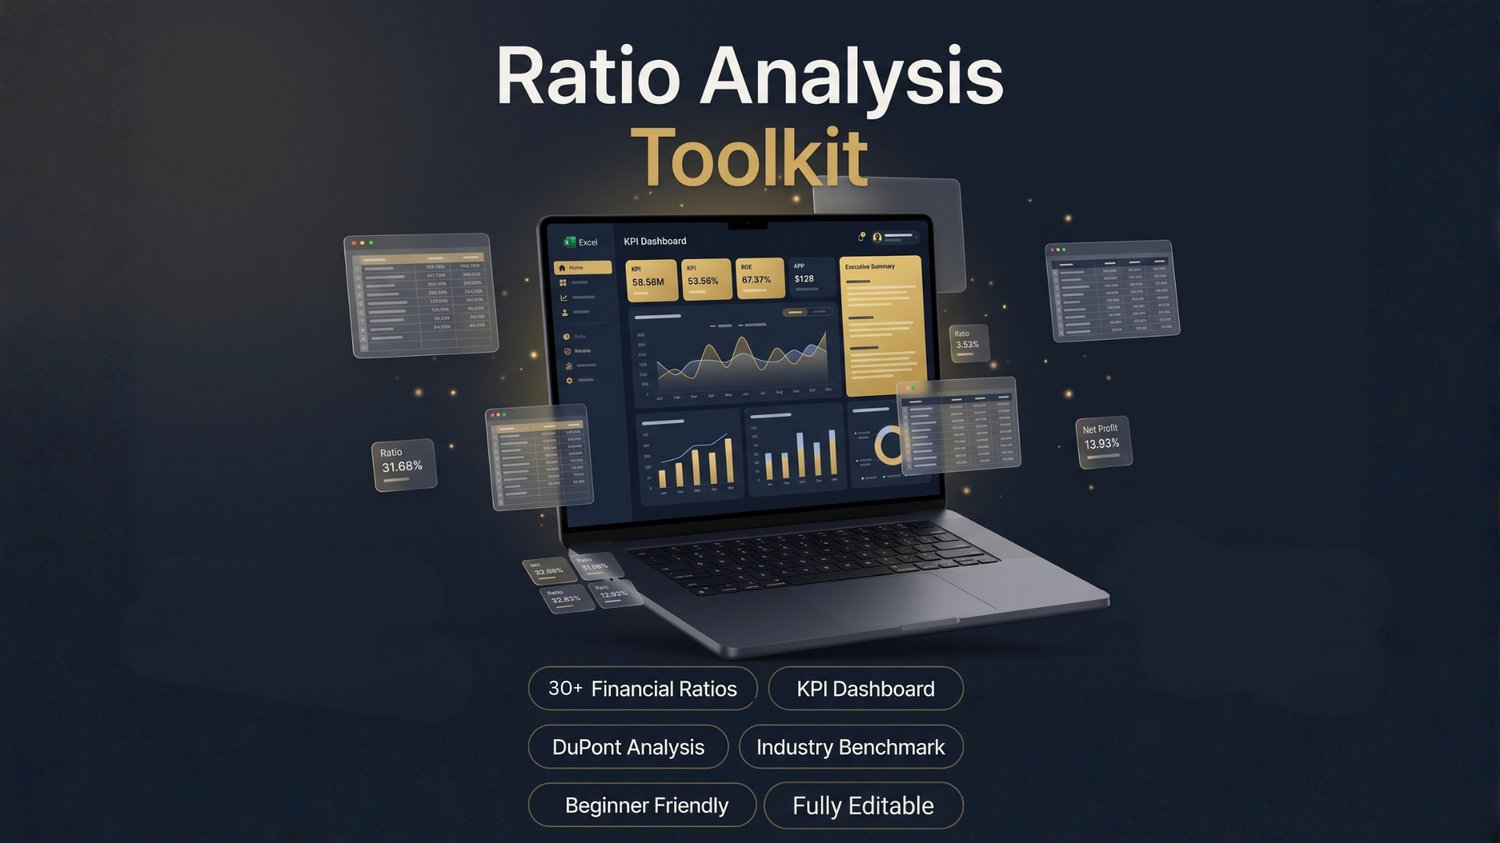
A ready-to-use Excel toolkit that turns raw financial statements into 35+ ratios, executive dashboards, and print-ready reports — no formulas to build, no finance degree required.
Key Features
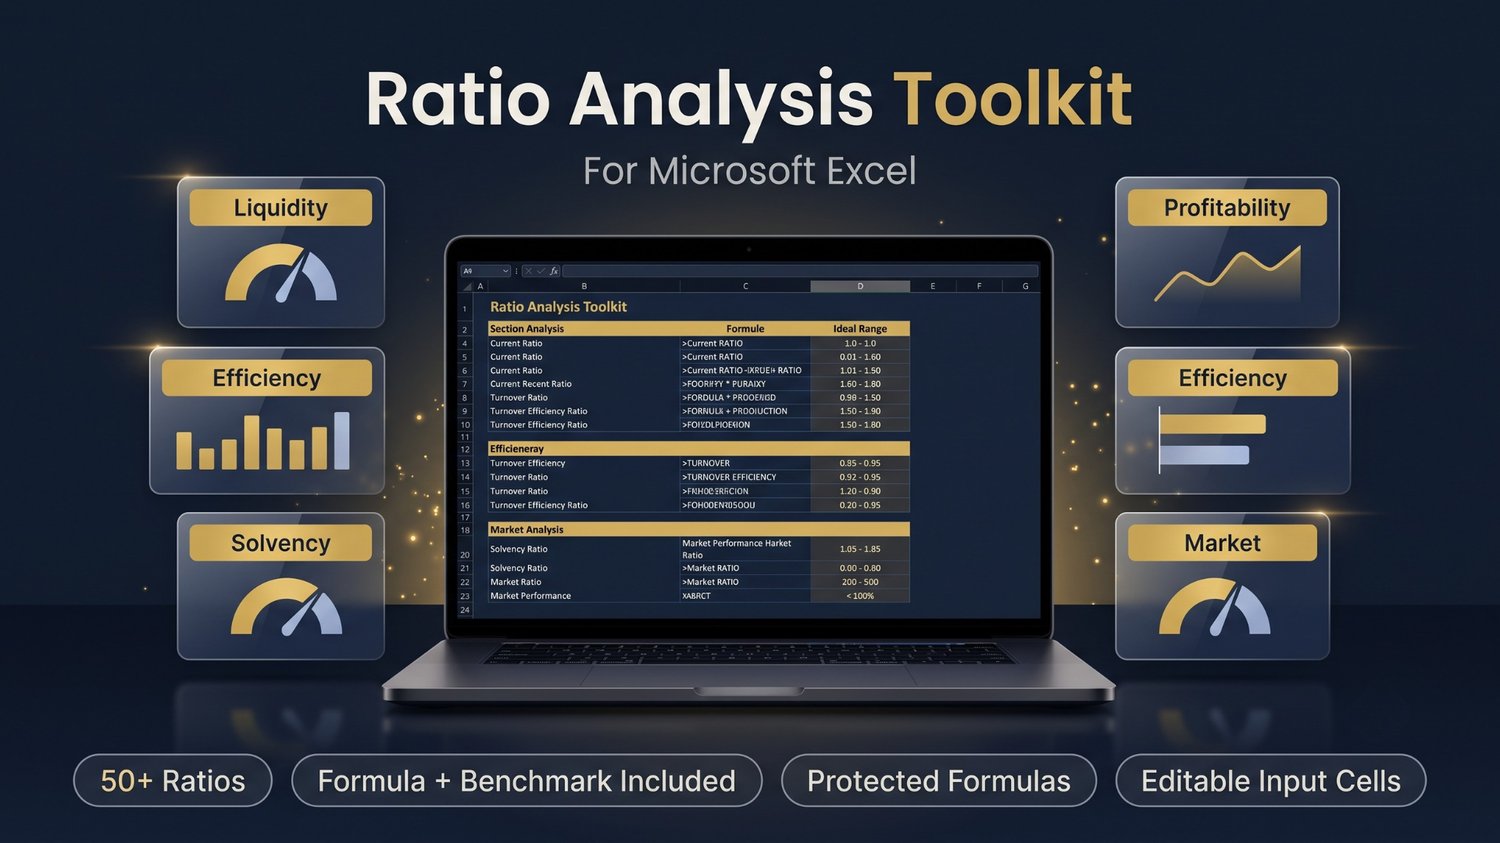
- 35+ financial ratios across Liquidity, Profitability, Efficiency, Solvency, and Market categories, each with its formula and an ideal benchmark range shown alongside the result
- Three full financial statements — Balance Sheet, Income Statement, Cash Flow Statement — with a 5-period (year) comparison
- Automatic error checking — built-in checks confirm your Balance Sheet balances and your Cash Flow ties to your cash balance
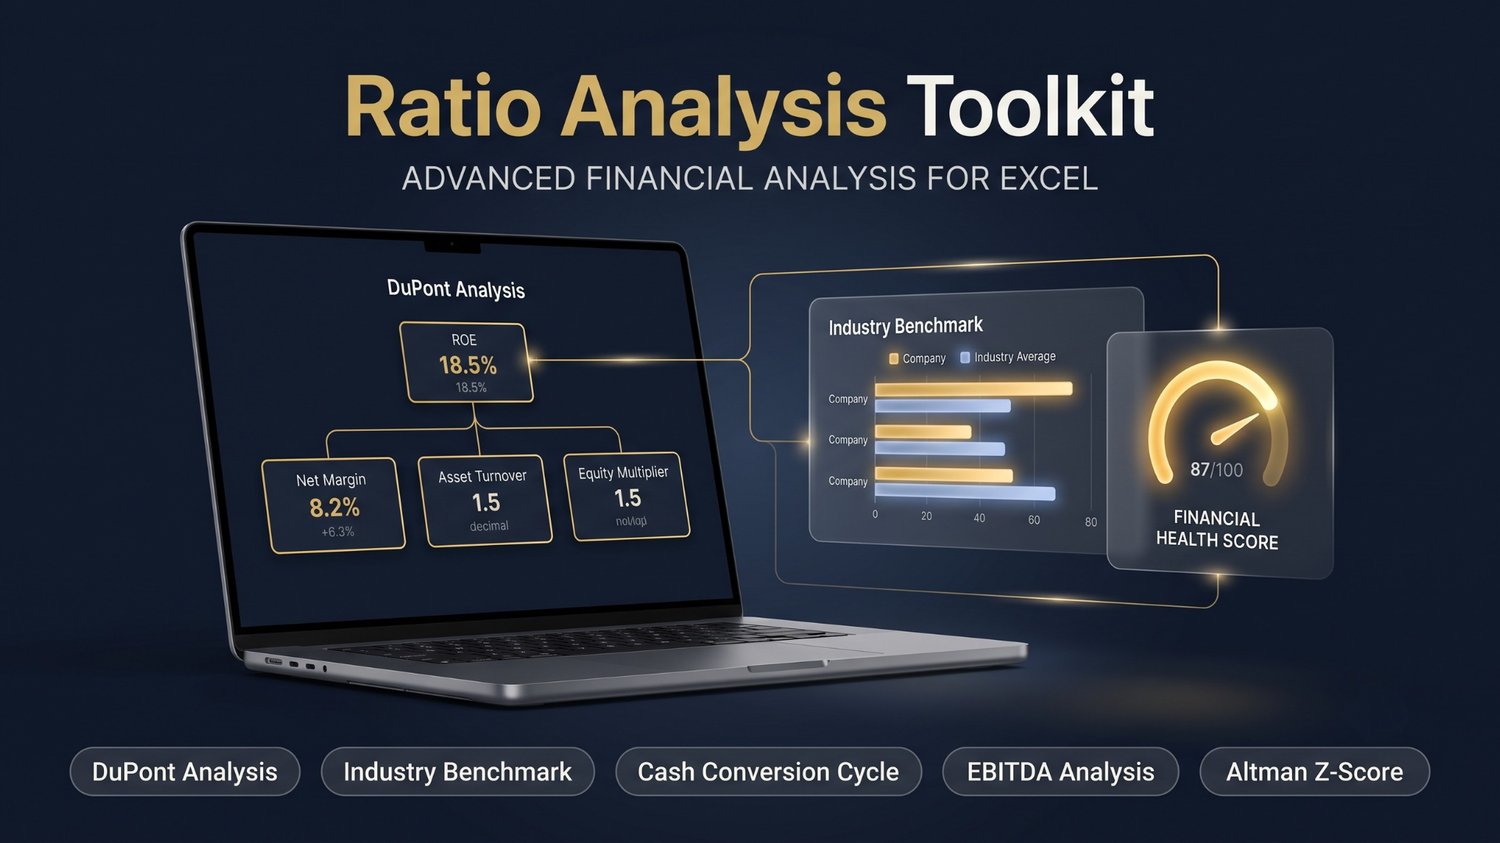
- DuPont Analysis — see exactly what is driving your Return on Equity
- Industry Benchmark comparison — compare your company against editable industry-standard ratios
- Trend, Common Size, Horizontal & Vertical Analysis — see how your business is changing over time and how your statement structure compares period to period
- Working Capital, Cash Conversion Cycle & EBITDA Analysis
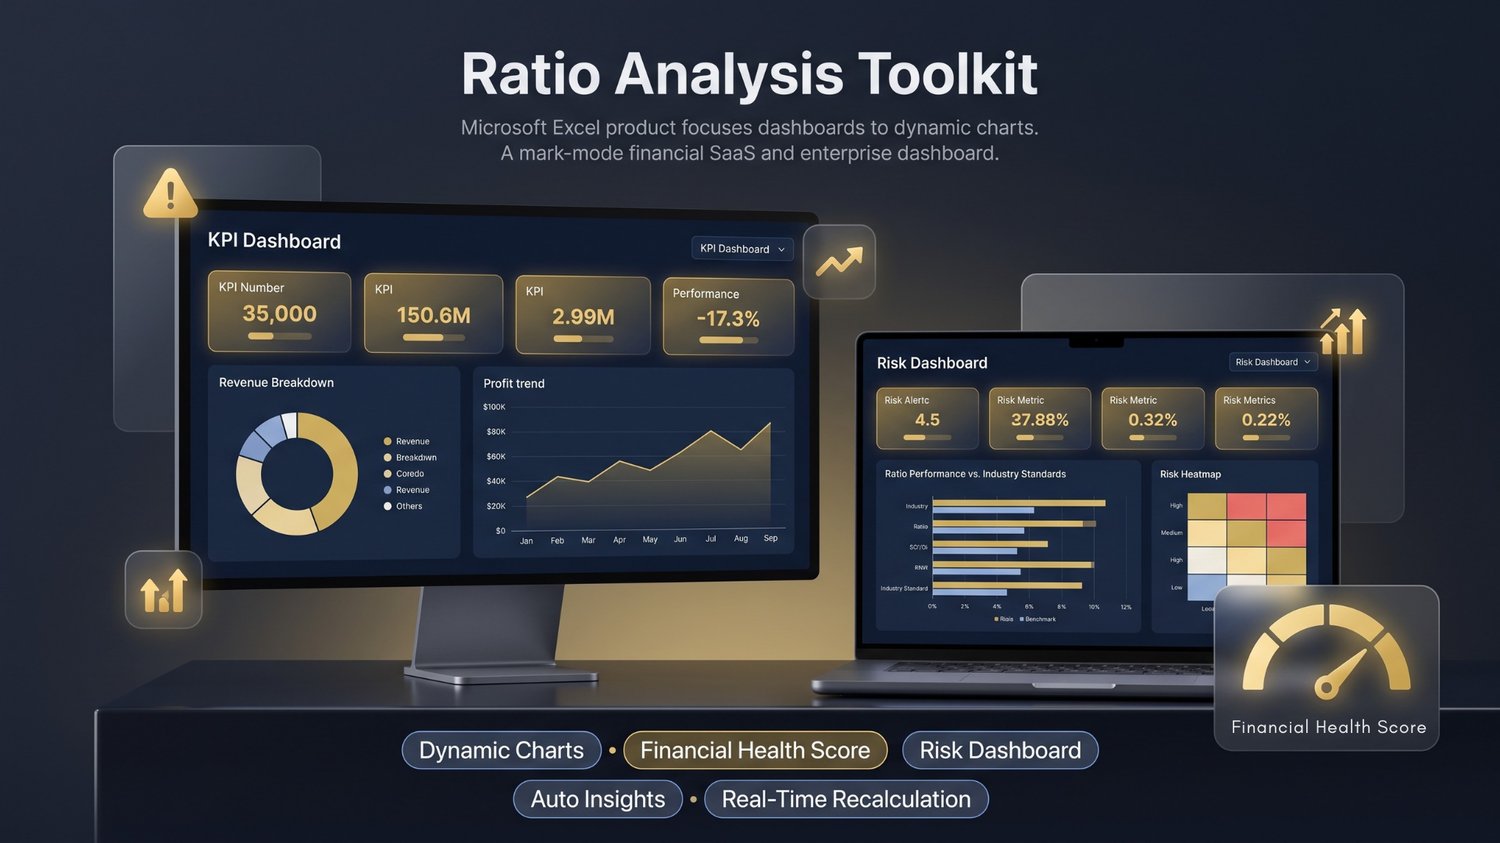
- Financial Health Score & Risk Dashboard — automatic, rules-based flags on liquidity, leverage, and profitability risk
- KPI Dashboard with live charts and an Executive Summary page
- Printable Report — a clean, board-ready, print-formatted summary
- Protected formulas — every calculation is locked so it can't be accidentally broken; only your input cells are editable
- Dark, professional interface with tile-based navigation and one-click hyperlinks between every section
- Full documentation included — User Guide, Formula Guide, and FAQ, built directly into the workbook
Benefits
- Save hours you would otherwise spend building formulas, formatting, or looking up ratio definitions
- Avoid formula errors — every calculation has already been checked; you only touch the input cells
- Look professional in front of clients, lenders, or your own management team with a polished, dashboard-driven output instead of a plain spreadsheet
- Understand your numbers, not just calculate them — every ratio comes with its ideal benchmark range, so you know what "good" looks like
- Reuse it indefinitely — analyze as many periods, or as many clients/companies (one at a time), as you need, for as long as you own the license
- No software to install — works in the Excel you already have
What's Included
- 1 fully built Excel workbook (.xlsx), 31 connected tabs, compatible with Excel 2016+ and Microsoft 365
- Financial Statements: Balance Sheet, Income Statement, Cash Flow Statement
- Ratio Suites: Liquidity, Profitability, Efficiency, Solvency, Market
- Advanced Analysis: DuPont, Industry Benchmark, Trend, Common Size, Horizontal, Vertical, Working Capital, Cash Conversion Cycle, EBITDA Analysis, Financial Health Score, Risk Dashboard
- Reporting: KPI Dashboard, Executive Summary, Dynamic Charts, Printable Report
- Documentation: User Guide (PDF), Formula Guide (PDF), FAQ (PDF), Setup & Installation Guide (PDF), ReadMe (PDF — includes the sheet-unlock code), Version History
- Commercial-Use License (Terms of Use)
Perfect For
- Accountants and bookkeepers preparing client-ready financial reports
- Financial analysts and FP&A professionals who need a fast, reusable ratio model
- Small business owners who want to understand their own numbers without hiring an analyst
- Consultants and freelancers who analyze multiple clients' financials
- MBA and finance students learning ratio analysis and financial statement modeling
- Startup founders preparing financials for investors or lenders
System Requirements
- Microsoft Excel 2016 or later, or Microsoft 365 (Windows or Mac)
- No macros, no add-ins, no internet connection required to use the workbook
- Not tested for Google Sheets or other spreadsheet software — some formatting and cell-protection features may not carry over
Frequently Asked Questions
Do I need advanced Excel skills to use this?
No. You only enter data into the clearly marked blue input cells. Every calculation is already built and automatically updates.
Can I use this for my clients, not just my own business?
Yes. You can use the toolkit to analyze and prepare reports for as many clients or companies as you like, one company's data at a time, under the included commercial-use license.
Does it work in a currency other than USD?
Yes. Set your reporting currency and symbol on the Company Info tab, and it applies across the entire workbook.
Why are some cells locked?
Formula cells are protected so they can't be accidentally overwritten. Only the blue input cells and amber assumption/benchmark cells are editable. An unlock code is included in the ReadMe.pdf file if you need to make structural changes.
Can I customize the colors, currency, or benchmarks?
Yes. Currency, industry benchmark values, and company details are all editable. The color theme can be adjusted like any Excel workbook.
Is there support if I get stuck?
Yes — the toolkit includes a full User Guide, Formula Guide, and FAQ, and you can reach out with any product questions after purchase.
Do I get updates if the toolkit improves?
Refer to your platform's (Gumroad/Payhip) update policy — updates, if released, will be made available through your purchase.
Commercial License
This toolkit is licensed for personal and commercial use by the purchaser.
You Can
- Use it, as-is, to analyze your own company's finances
- Use it to prepare financial analysis and reports for your clients
- Customize labels, currency, benchmarks, and branding for your own or client work
- Share the reports, charts, and PDFs you generate with clients, employers, or investors
You Cannot
- Resell, redistribute, or share the toolkit file itself
- Upload the file (as-is or modified) to any marketplace, template store, or file-sharing platform
- Present the toolkit's structure or formulas as your own original work
- Use it as the basis for a competing ratio-analysis or financial-template product
One license = one user/business. Full terms are included in the download.
Product Highlights
- 35+ institutional-grade financial ratios, auto-calculated
- 31 fully connected tabs — statements, ratios, dashboards, reports
- Built-in error checking on every financial statement
- DuPont Analysis, Industry Benchmarking, Financial Health Score
- Live KPI Dashboard and print-ready Executive Summary
- Formulas protected — safe from accidental changes
- Full documentation included — no guesswork
- Works in the Excel you already own — no add-ins, no macros
Product Info:
What You Will Receive:
You will receive,
✔ 1 fully built Excel financial analysis workbook — 31 connected tabs.
✔ Balance Sheet, Income Statement & Cash Flow Statement, plus 35+ auto-calculated ratios.
✔ DuPont Analysis, Industry Benchmark, KPI Dashboard & Executive Summary.
✔ Full documentation — User Guide, Formula Guide, FAQ & Setup Guide (PDF).
✔ Instant download. Commercial use allowed.
- Category: Excel Financial Analysis Toolkit
- Total Tabs: 31 connected worksheets
- Ratios Included: 35+ (Liquidity, Profitability, Efficiency, Solvency, Market)
- Reporting Periods: 5-year comparison (Balance Sheet, Income Statement, Cash Flow)
- Advanced Analysis: DuPont, Industry Benchmark, Trend, Common Size, Horizontal, Vertical, Working Capital, Cash Conversion Cycle, EBITDA, Financial Health Score, Risk Dashboard
- Reporting Tools: KPI Dashboard, Executive Summary, Dynamic Charts, Printable Report
- Compatibility: Microsoft Excel 2016+ & Microsoft 365 (Windows/Mac)
- File Format: XLSX (workbook) + PDF (documentation)
- Protection: Locked formulas, editable input cells
- Documentation: User Guide, Formula Guide, FAQ, Setup Guide, Version History
- License: Commercial Use (Personal & Client Work)
- Language: English