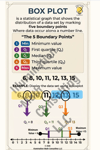
Box Plot Anchor Chart Set — Odd & Even Data Examples
On Sale
$10.00
$10.00
- Help students finally understand quartiles, medians, and five‑number summaries with this clear, classroom‑ready Box Plot Anchor Chart Set.
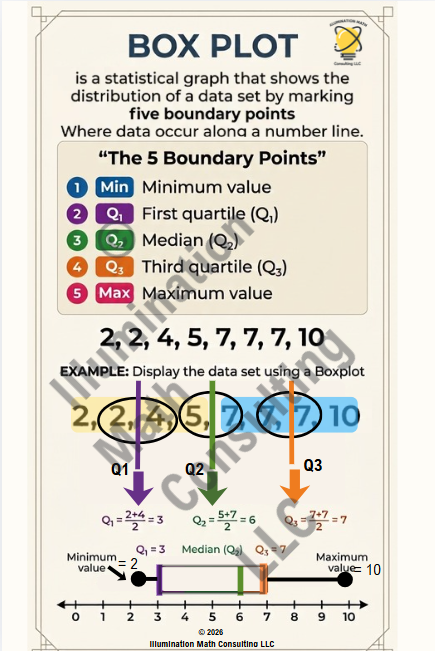
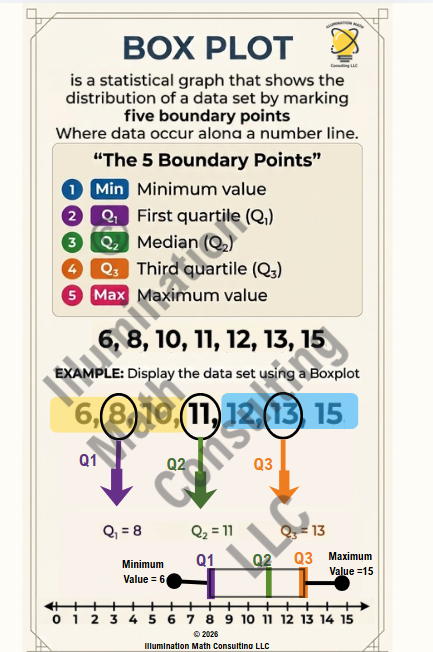
- This resource includes two high‑quality posters: one using an odd-numbered data set and one using an even-numbered data set, so students can see exactly how the process changes depending on the type of data.
Each chart walks learners through:
- Ordering the data
- Finding Q₁, Q₂ (median), and Q₃
- Calculating quartiles step‑by‑step
- Identifying minimum and maximum values
- Displaying the full box plot on a number line
Designed with clean visuals, color‑coded quartile markers, and easy‑to-read formatting, these posters make an excellent addition to math walls, guided notes, small‑group instruction, and test‑prep review.
Includes:
✔ 2 printable PDF posters (odd + even data sets)
✔ Step-by-step quartile calculations
✔ Number line box plot visuals
- Learning Objectives: 6.NR.2.2
Single‑Teacher License: You may use this resource with your own students only. Sharing the PDF or Google Slides with other teachers, schools, or public sites is not permitted.
© 2026 Illumination Math Consulting LLC. For classroom use only. Not for resale or redistribution.