

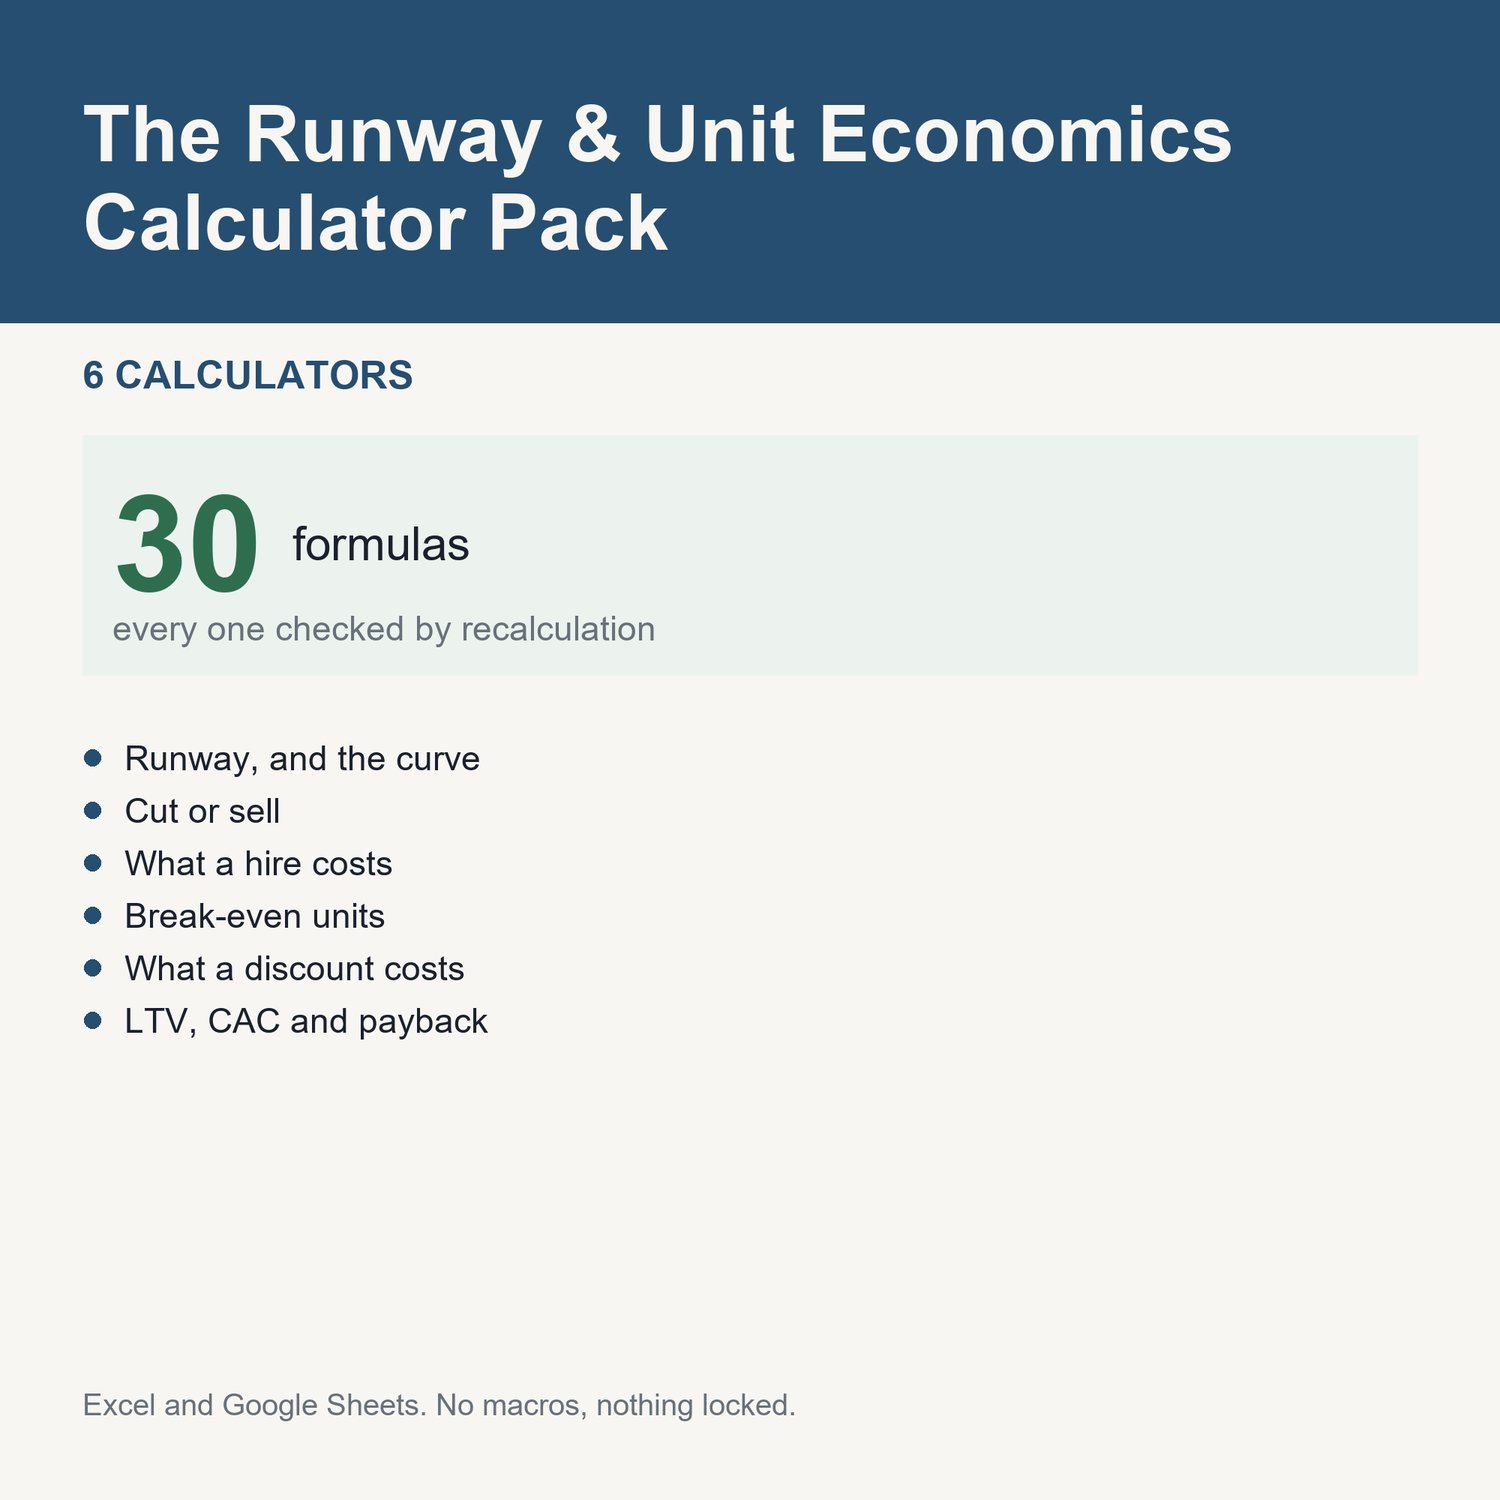



The Runway & Unit Economics Calculator Pack — Six linked calculators, every formula checked by recalculation
Six calculators for the numbers that decide whether a company survives its own growth. Sheet 1 is worth typing into twice -- once with a 25% cut and once with a 25% rise -- because runway is 1/x and the asymmetry is easy to miss. Sheet 6 contains the finding most worth knowing: payback does not move with churn, so two companies with identical payback can be in completely different positions. Every formula was recalculated and checked against an independent implementation before this shipped.
What is in it
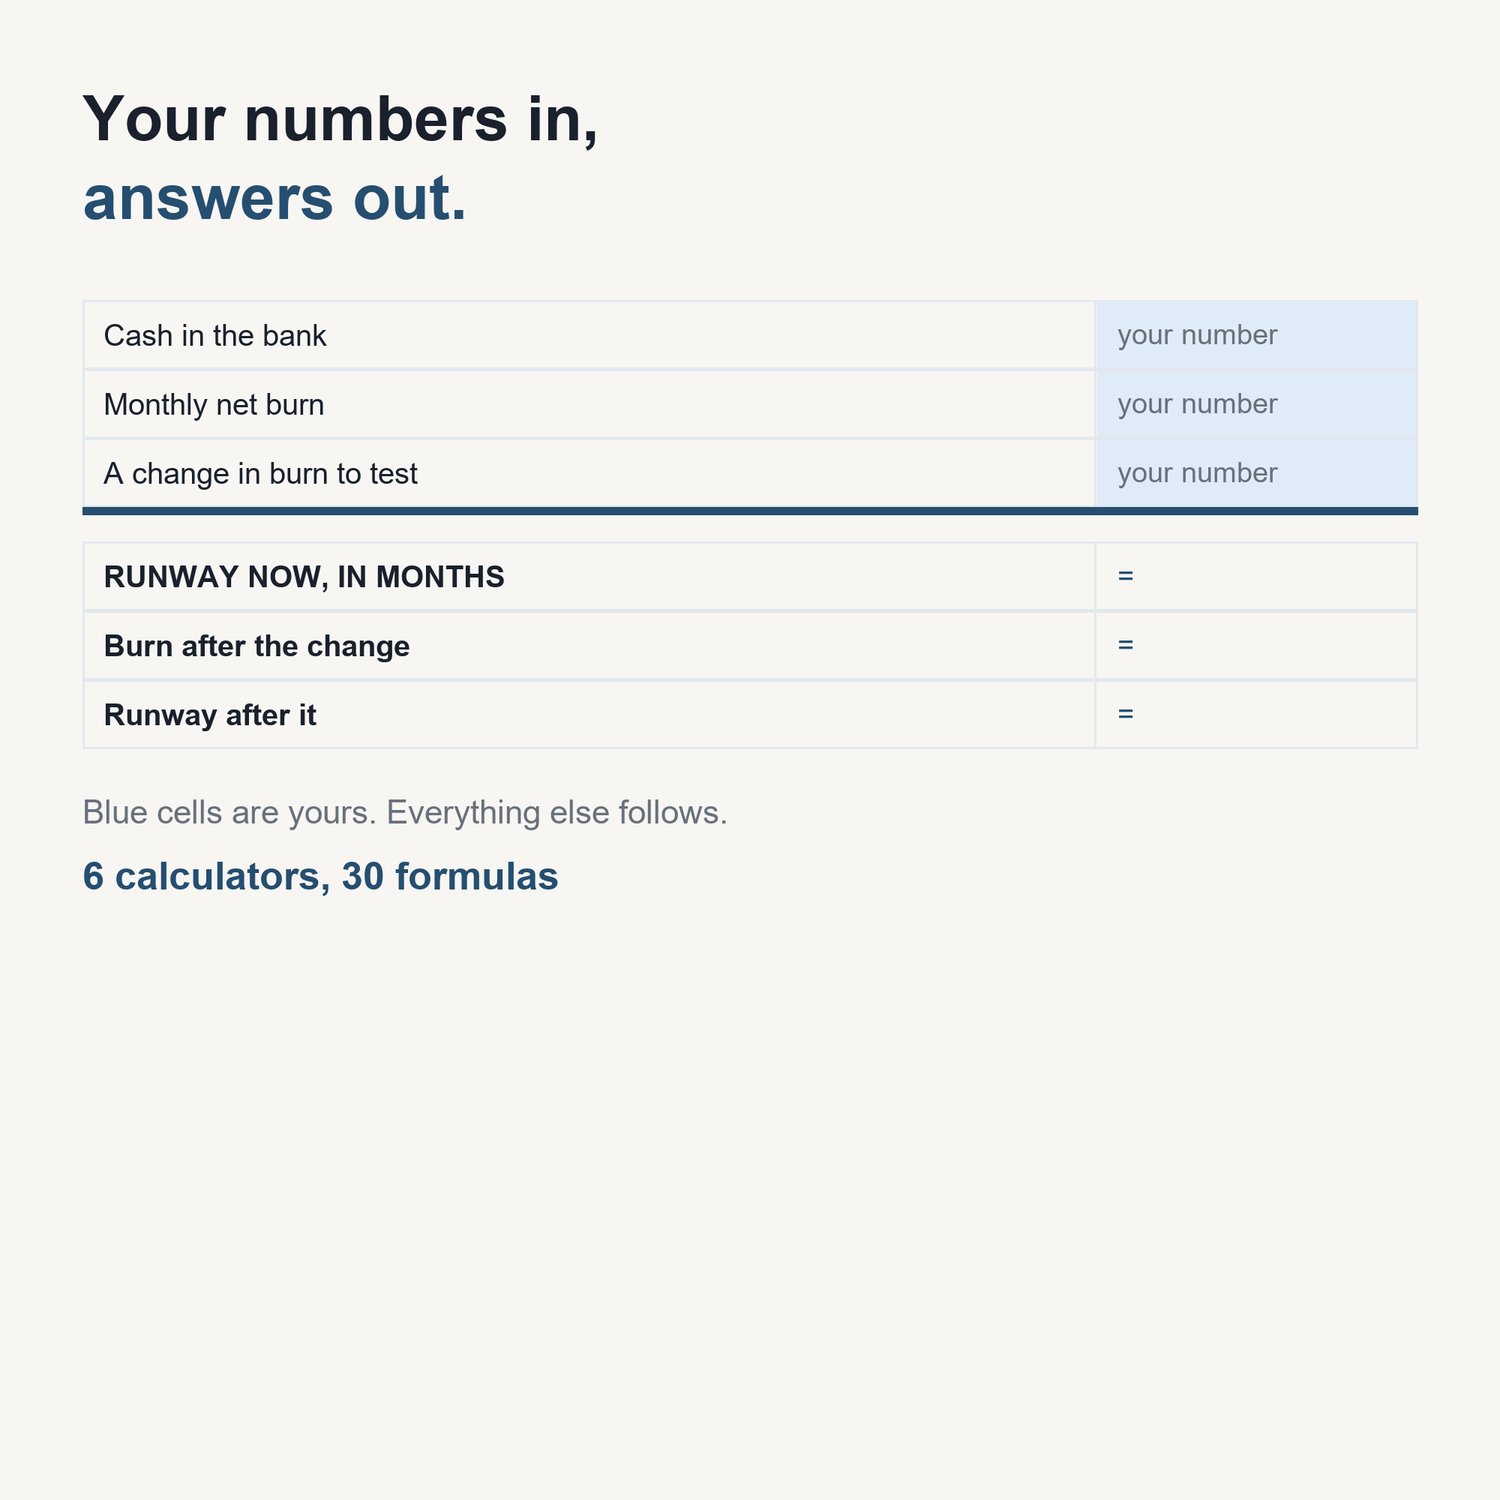
6 calculators, one per sheet. Overwrite the blue cells with your own numbers and everything else follows — nothing is locked, there are no macros, and it opens in Excel, Numbers, LibreOffice and Google Sheets.
- Runway, and the curve — How long do you have, and what does a change in burn do?
- Cut or sell — Which buys more time -- cutting a dollar or selling one?
- What a hire costs — How much runway does one more salary consume?
- Break-even units — How many do you have to sell to cover the fixed costs?
- What a discount costs — How much more volume does a price cut require?
- LTV, CAC and payback — Can you afford to acquire a customer?
Every formula was checked
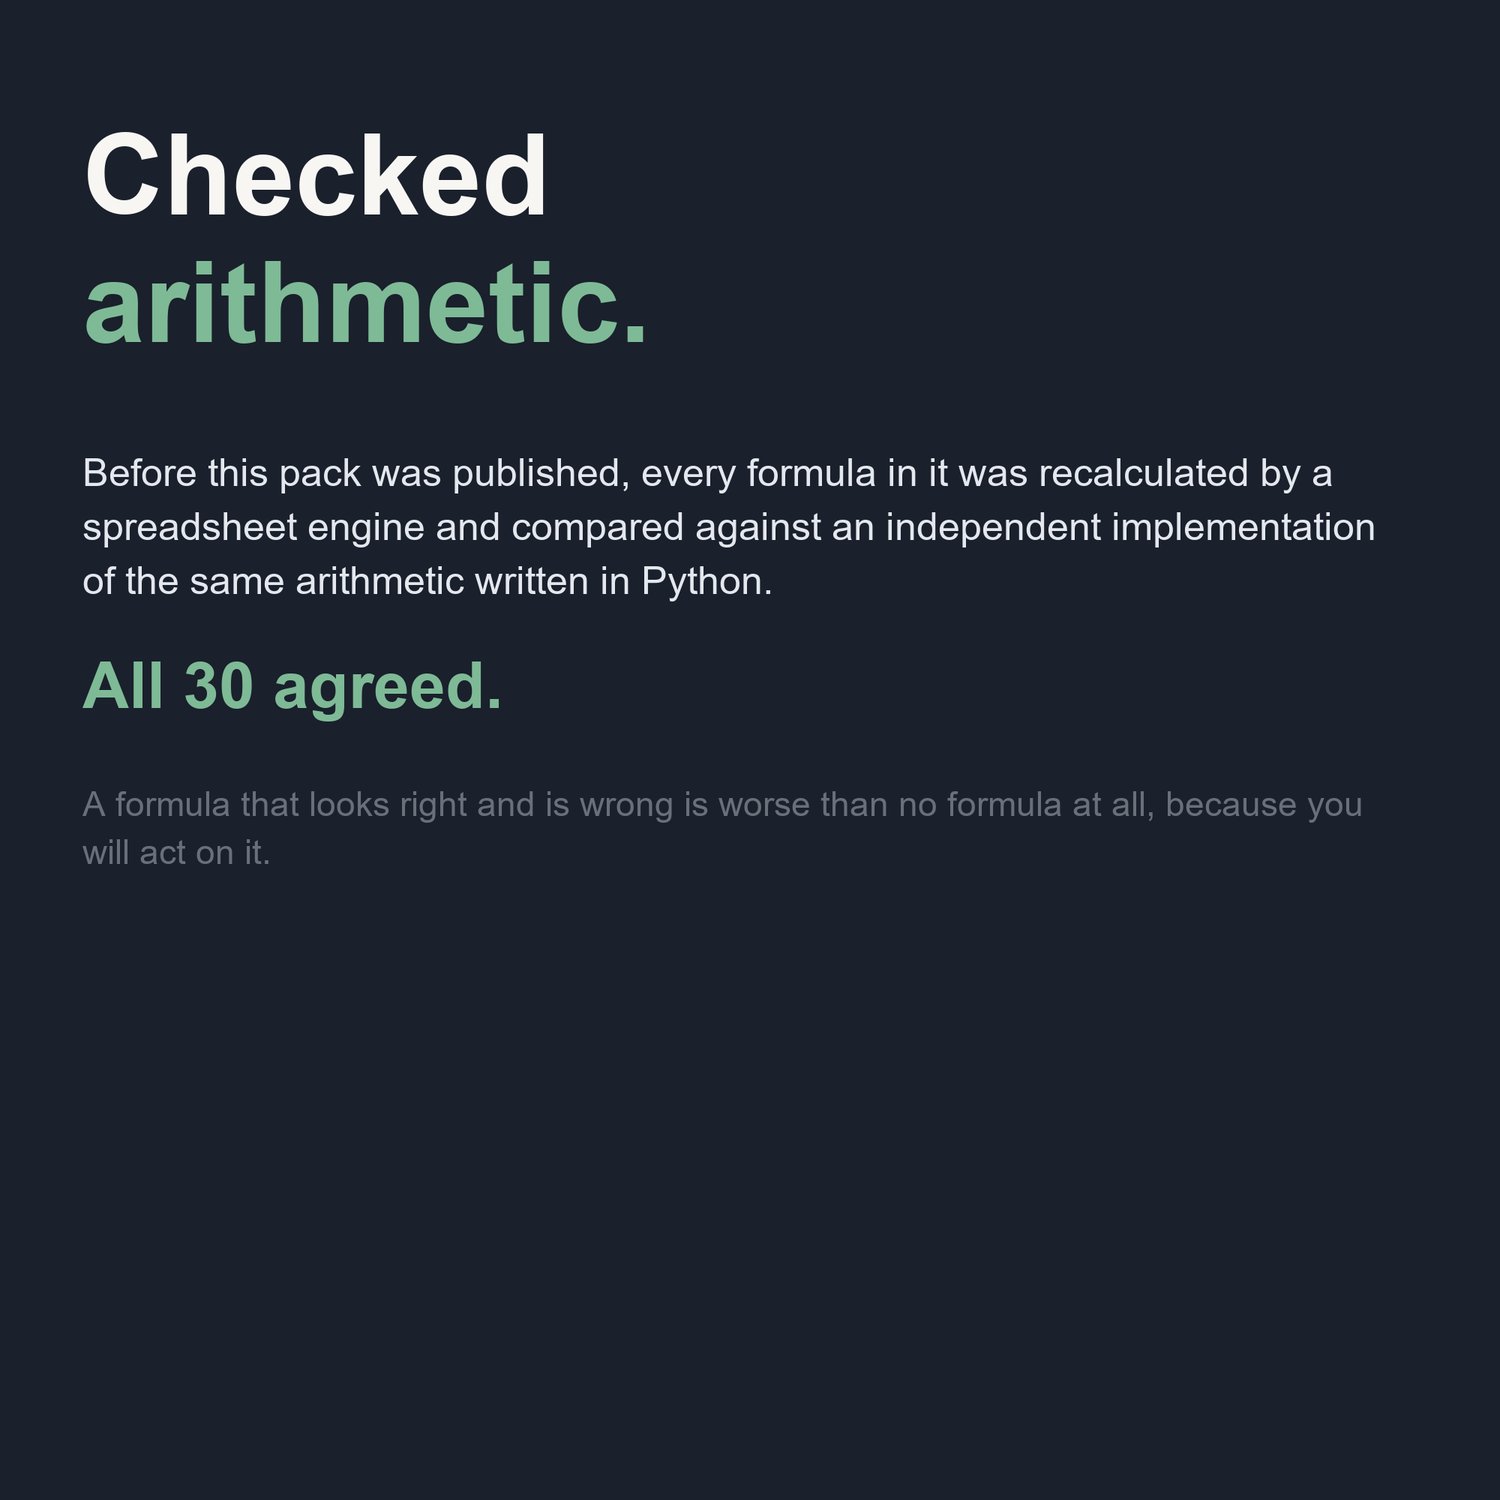
This pack contains 30 formulas. Before it was published, every one of them was recalculated by a spreadsheet engine and compared against an independent implementation of the same arithmetic written in Python. All 30 agreed to within a cent, and the workbook carries a Verification sheet saying so.
That is an unusual thing to be able to claim about a spreadsheet, and it is the main reason to buy this one rather than download a free template. A formula that looks right and is wrong is worse than no formula at all, because you will act on it.
What each calculator assumes
There is a sheet listing this, because a calculator that hides its assumptions is just a number generator:
- Burn is flat. Real burn drifts up, which shortens everything.
- The gross margin is on NEW revenue, not blended. New business can be worse than the average.
- They actually reach the contribution figure, which makes this the optimistic case.
- Fixed costs really are fixed over the range you are testing.
- Variable cost per unit does not fall with volume. If it does, the discount is more affordable than this shows.
- Churn is constant, which it is not -- early churn is almost always higher. That makes LTV optimistic.
What this is not
Not financial, tax or legal advice, and not a recommendation to buy, sell, borrow or sign anything. These are calculators: they show what a choice costs, not which choice is right for you. Where a published rate or threshold is used it is the one current when the pack was built — those change, the arithmetic does not.
Honest about the format
One .xlsx workbook, 6 calculator sheets plus Start Here, Assumptions and Verification. Not a PDF, not a physical product, not a Notion template. Available immediately after purchase; nothing ships.
Refunds
If this isn't what you expected, email me within 30 days and I'll refund you in full — no need to explain. Because it's an instant download I can't take the file back, so I'd rather you just had your money back.