




Day Trading Explained — Measured (PDF Guide)
You were told day trading is where discipline pays, and that the one-hour chart is the sensible middle ground between noise and waiting. Nobody ran the standard rules on it against a control, so the middle ground has never actually been measured.
This guide runs all four of the wave's written-down rules on the one-hour bar, then takes the single result that cleared significance and tries four separate ways to break it. Three of the four succeed, and watching that happen is worth more than another clean null. This is a 45-page PDF that teaches Day Trading from the first thing you see on the screen through to a written strategy with an entry, a stop and an explicit rule for when the trade is wrong.
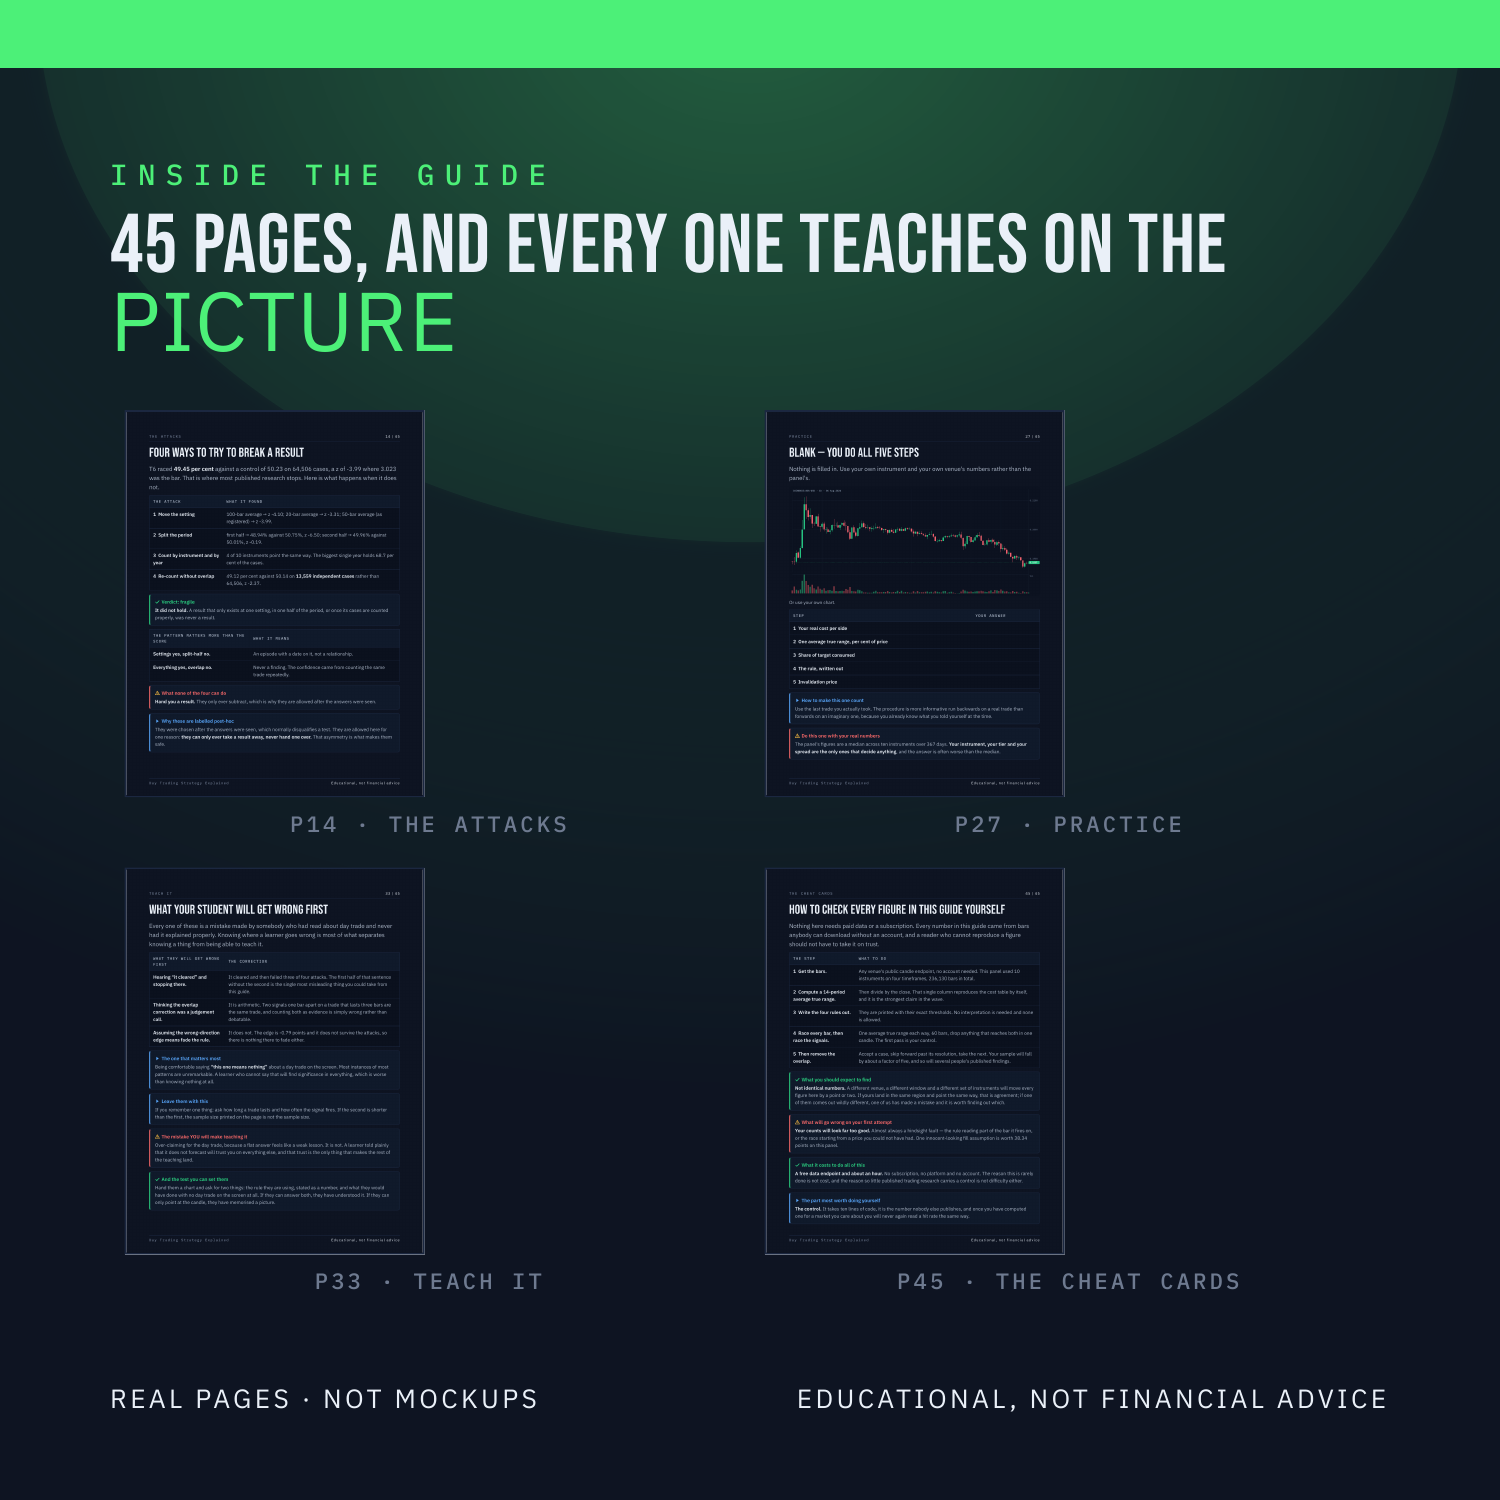
Nothing is taught underneath a chart. Every label sits on the candle, the line or the level it is describing, on real BTC, ETH, SOL and LINK charts. There are three quizzes on real charts, each followed by the same chart re-shown annotated with the reasoning, plus faded practice pages where the first steps are filled in and you finish the rest.
WHAT'S INSIDE
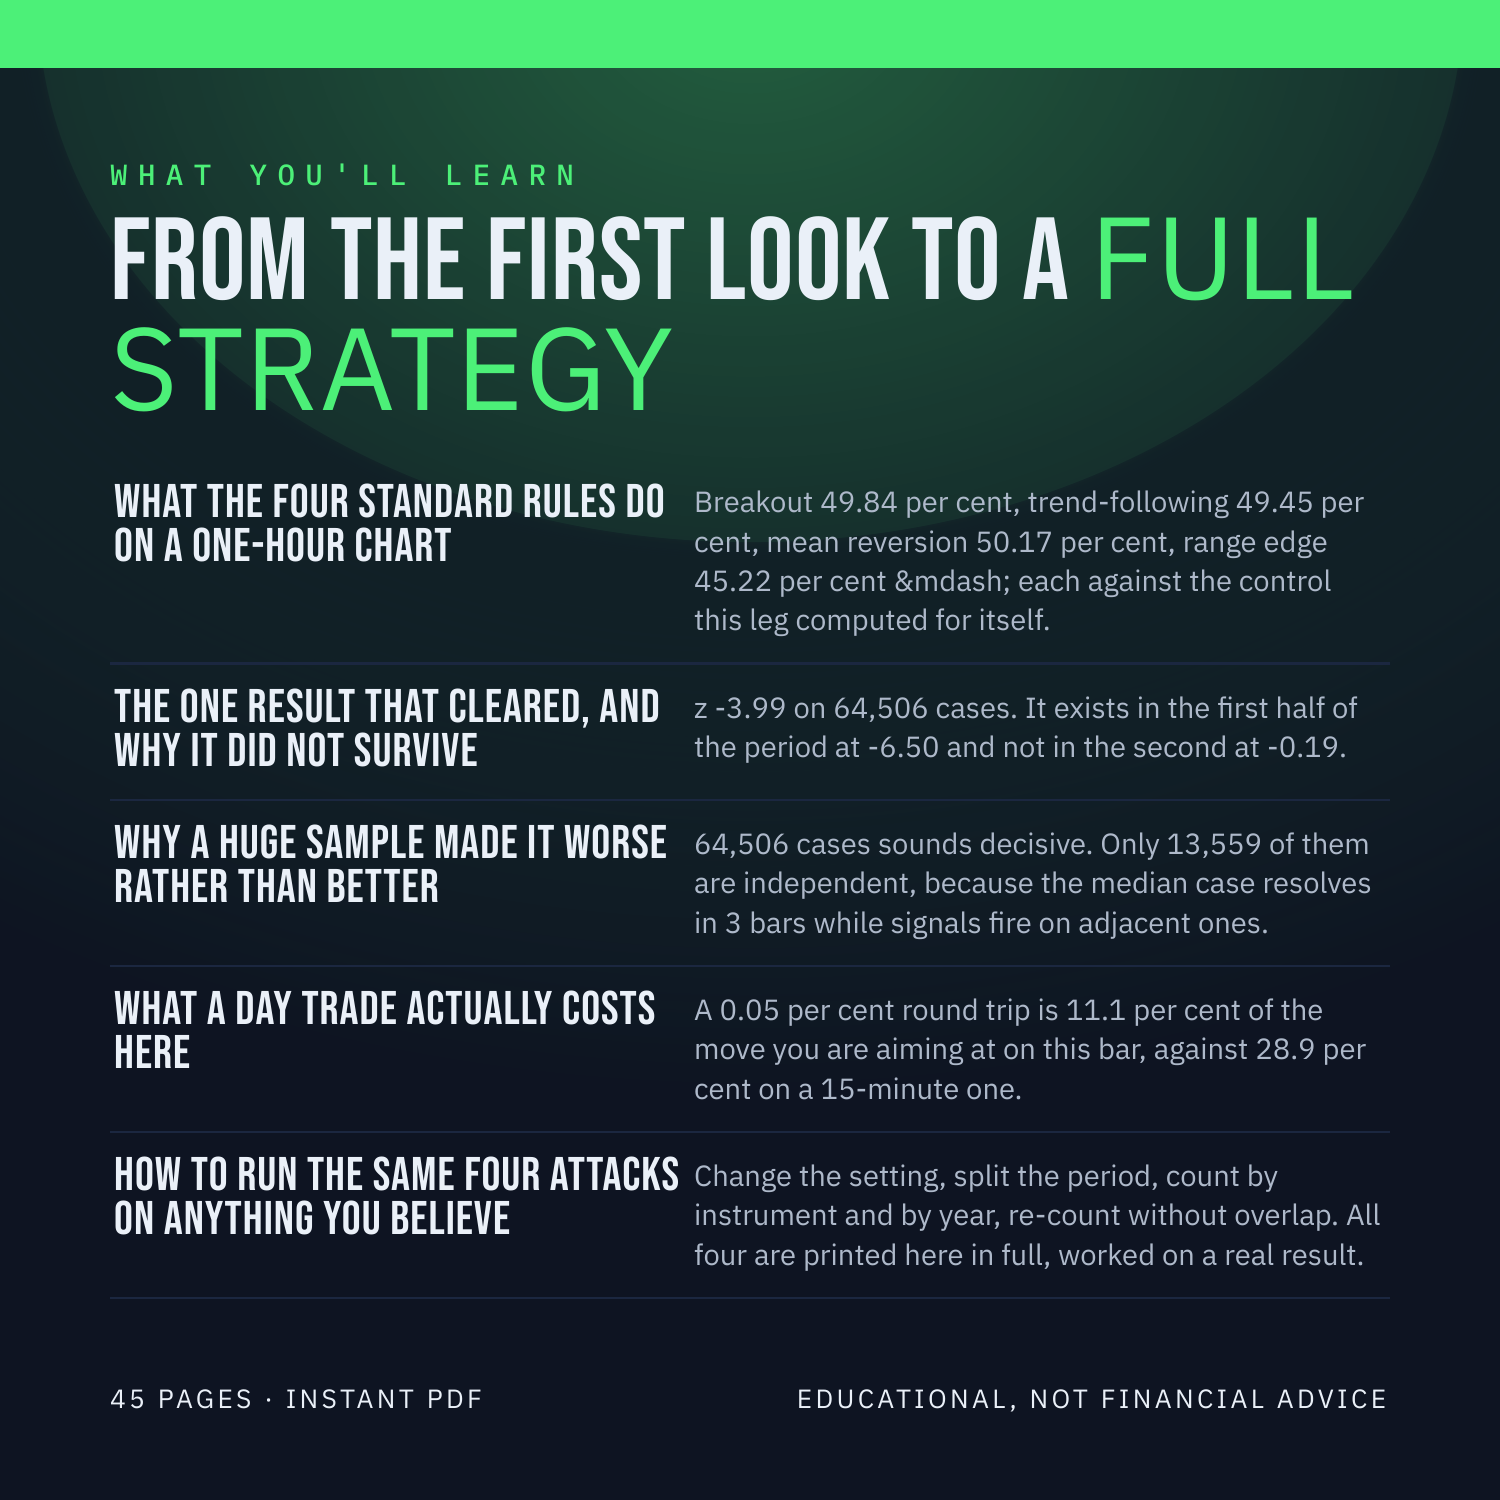
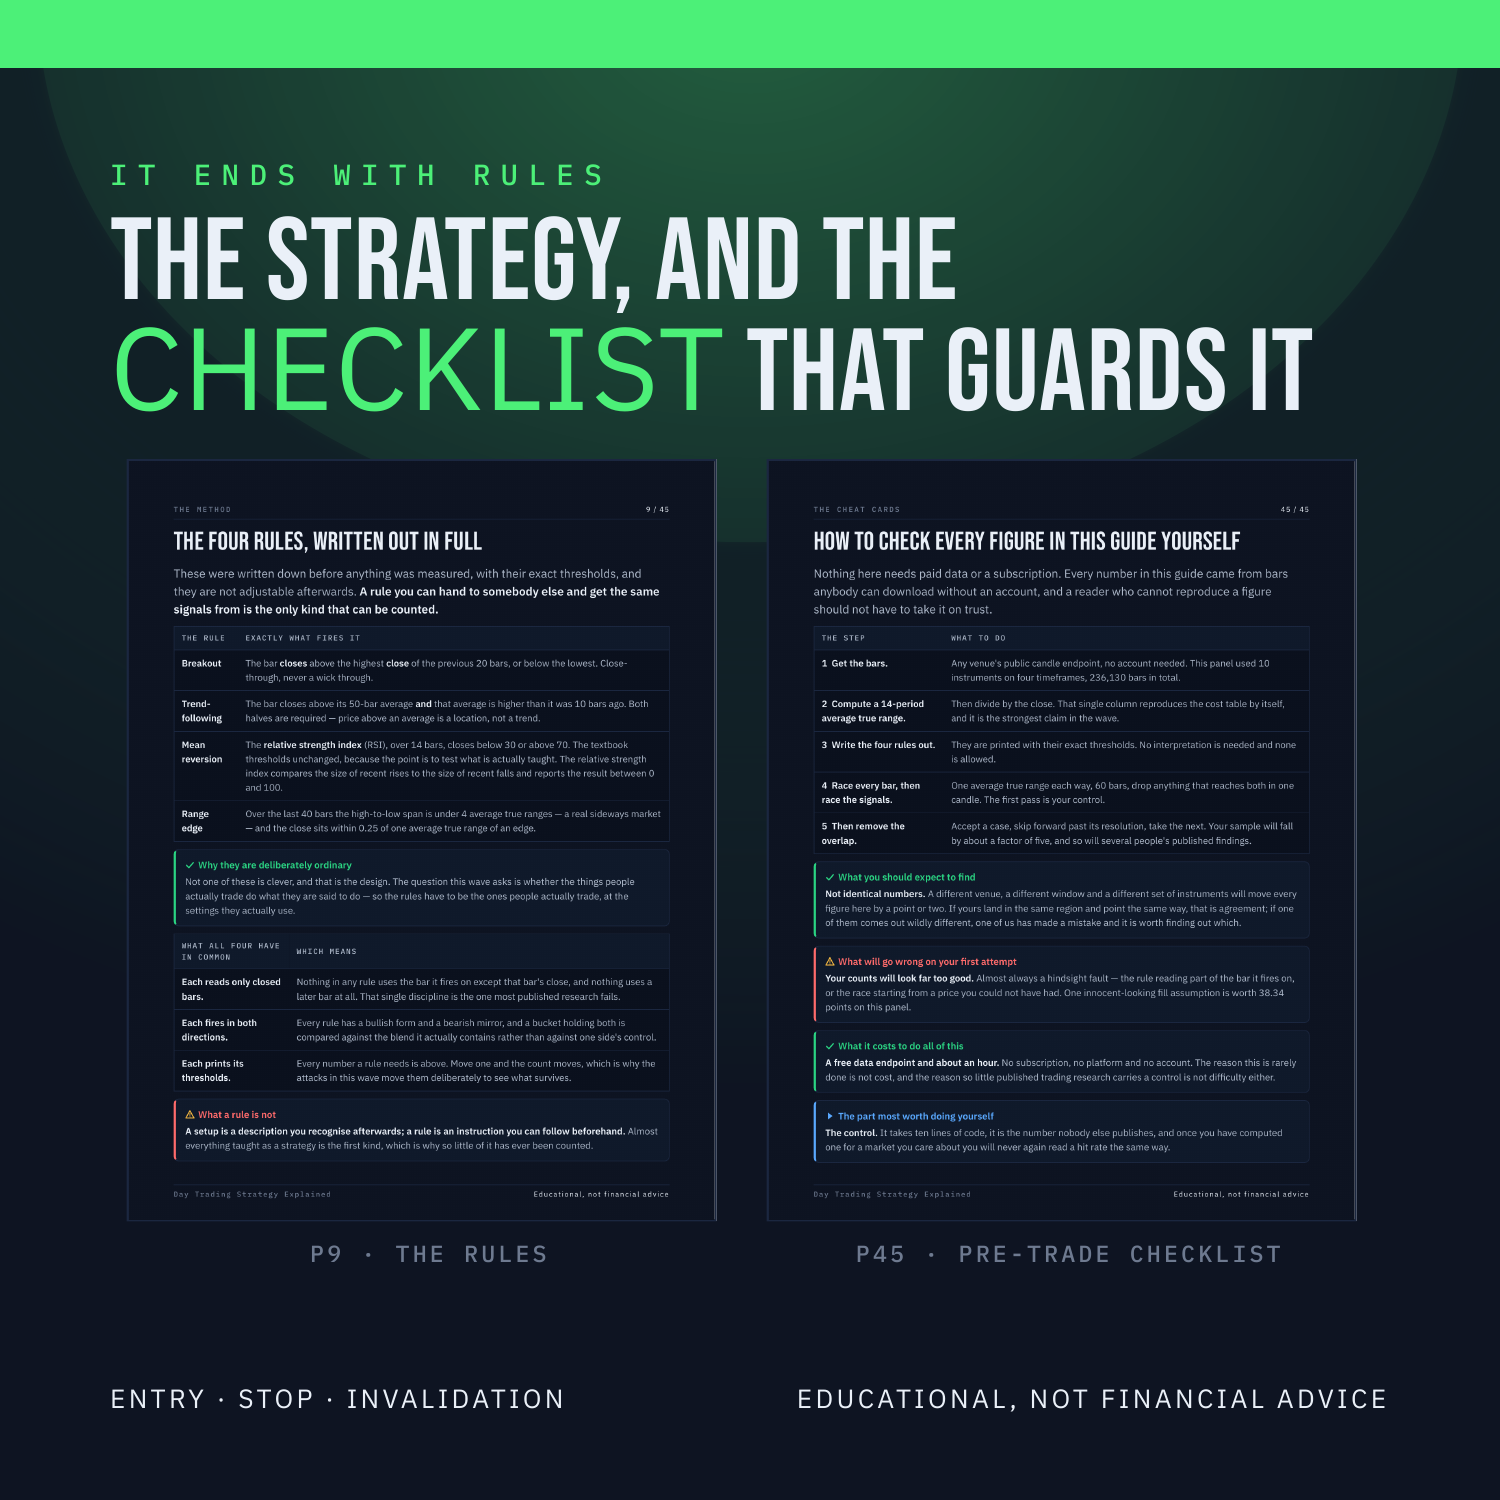
What the four standard rules do on a one-hour chart -- Breakout 49.84 per cent, trend-following 49.45 per cent, mean reversion 50.17 per cent, range edge 45.22 per cent, each against the control this leg computed for itself.
The one result that cleared, and why it did not survive -- z -3.99 on 64,506 cases. It exists in the first half of the period at -6.50 and not in the second at -0.19.
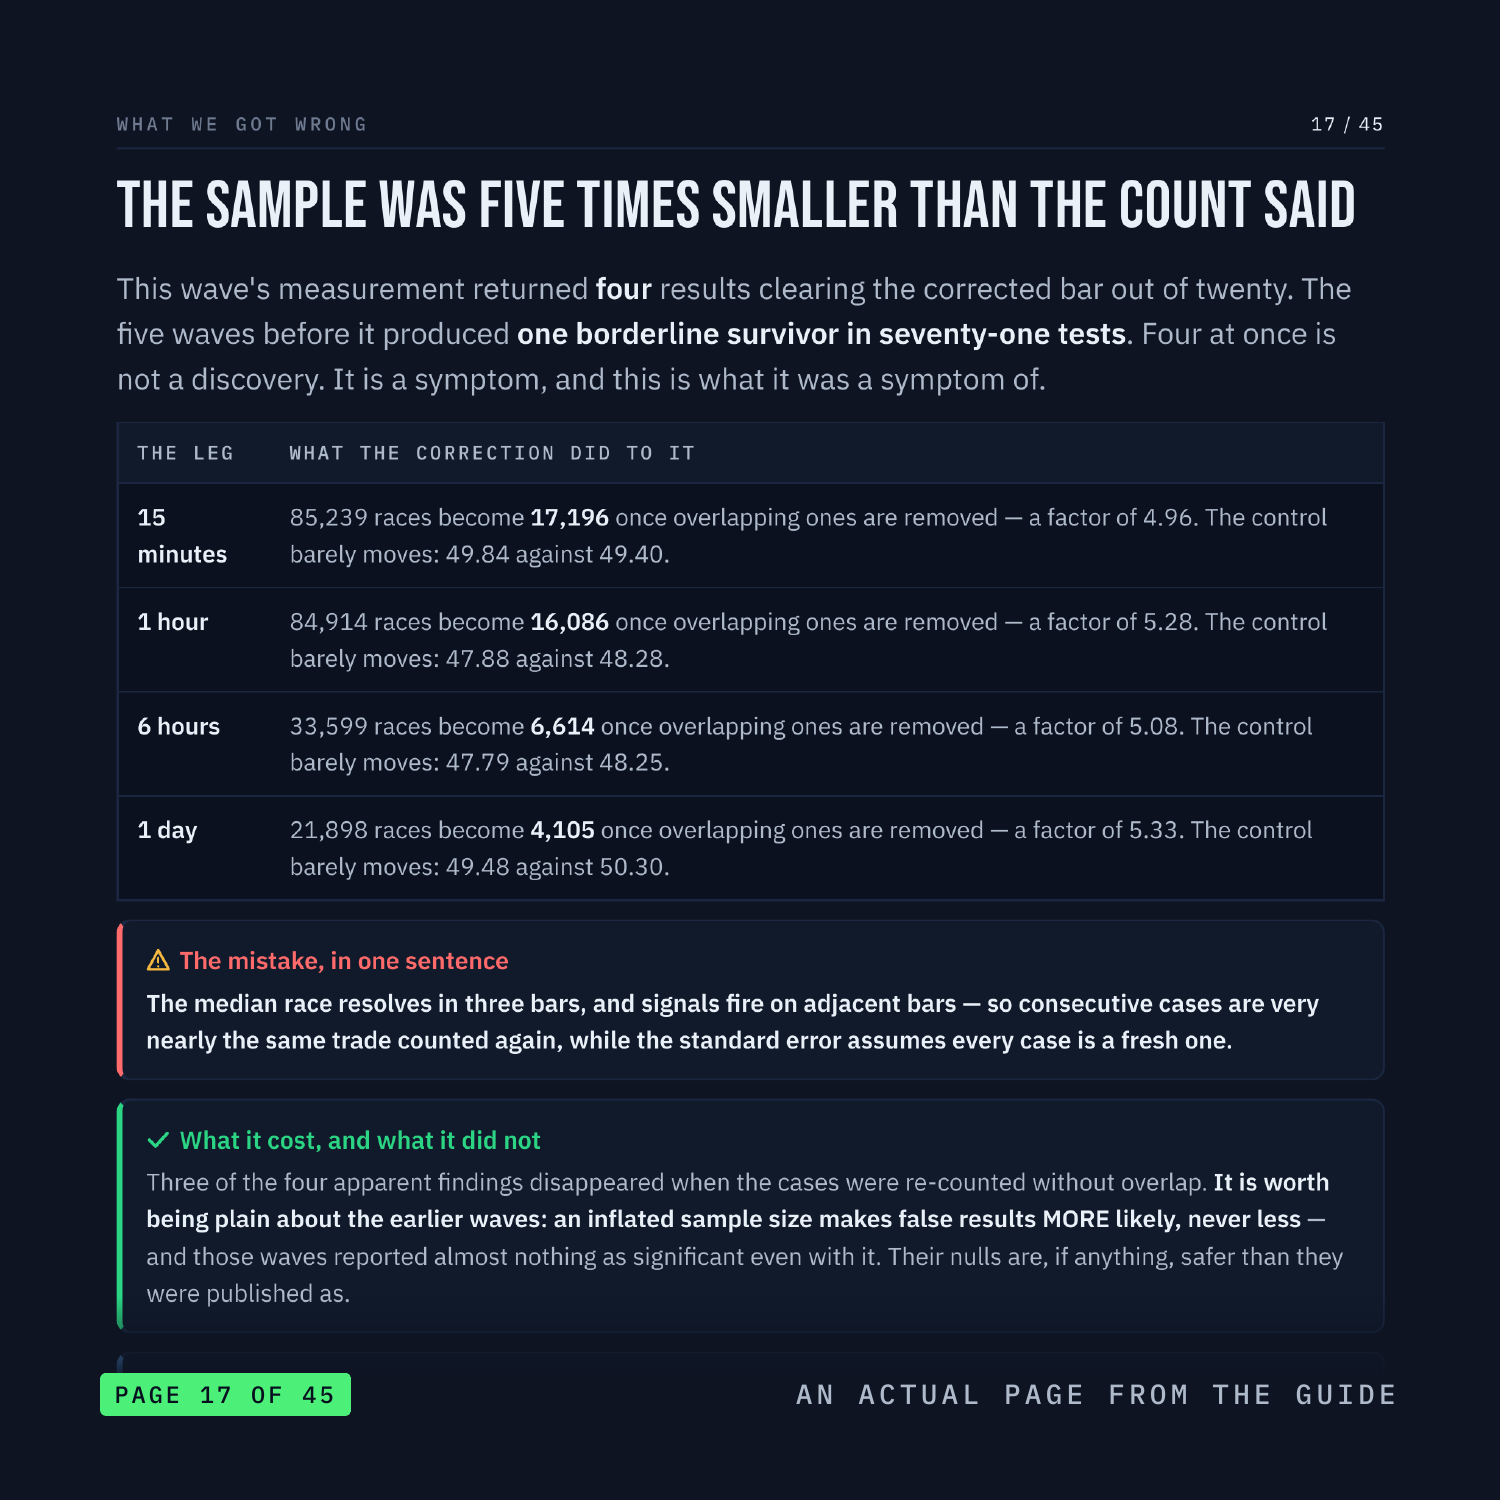
Why a huge sample made it worse rather than better -- 64,506 cases sounds decisive. Only 13,559 of them are independent, because the median case resolves in 3 bars while signals fire on adjacent ones.
What a day trade actually costs here -- A 0.05 per cent round trip is 11.1 per cent of the move you are aiming at on this bar, against 28.9 per cent on a 15-minute one.
How to run the same four attacks on anything you believe -- Change the setting, split the period, count by instrument and by year, re-count without overlap. All four are printed here in full, worked on a real result.
WHAT YOU'LL BE ABLE TO DO
Spot the shape of an overlapping-sample problem on sight.
Work out how many of your own cases are independent.
Run the four attacks on a result you already believe.
Tell a split-half failure from a settings failure, and say what each one means.
Read a large sample size without being reassured by it.
AN HONEST NOTE
Day Trading is a clue, not a crystal ball. It describes what price has already done. This guide contains no win-rates, no backtest results and no promises about what you will make, because nobody can verify those and you should not trust anyone who prints them. What it hands you instead is a set of rules you can test yourself on TradingView in an afternoon. Educational, not financial advice.
Instant download. 45 pages, PDF.