








Keltner Channels Explained — Ride the trend (PDF Guide)
You add Keltner Channels, price touches the upper band, you take it as overbought and sell - and price rides that band for another thirty bars without you. Then you go looking for better settings, change Length, and the bands behave exactly the same, because the number that controls their width is a different input you have not touched.
This guide is built on the thing almost no write-up mentions: Keltner has two separate lookbacks doing two separate jobs. This is a 50-page PDF that teaches Keltner Channels from the first thing you see on the screen through to a written strategy with an entry, a stop and an explicit rule for when the trade is wrong.
Nothing is taught underneath a chart. Every label sits on the candle, the line or the level it is describing, on real market data. There are three quizzes on real charts, each followed by the same chart re-shown annotated with the reasoning, plus faded practice pages where the first steps are filled in and you finish the rest.
WHAT'S INSIDE
- All six inputs, and what each one really changes - Length, Multiplier, Source, Use Exponential MA, Bands Style and ATR Length, measured on real data.
- The two lookbacks nobody notices - Length moves the middle line, ATR Length moves the bands away from it. Same chart, same basis, completely different band behaviour.
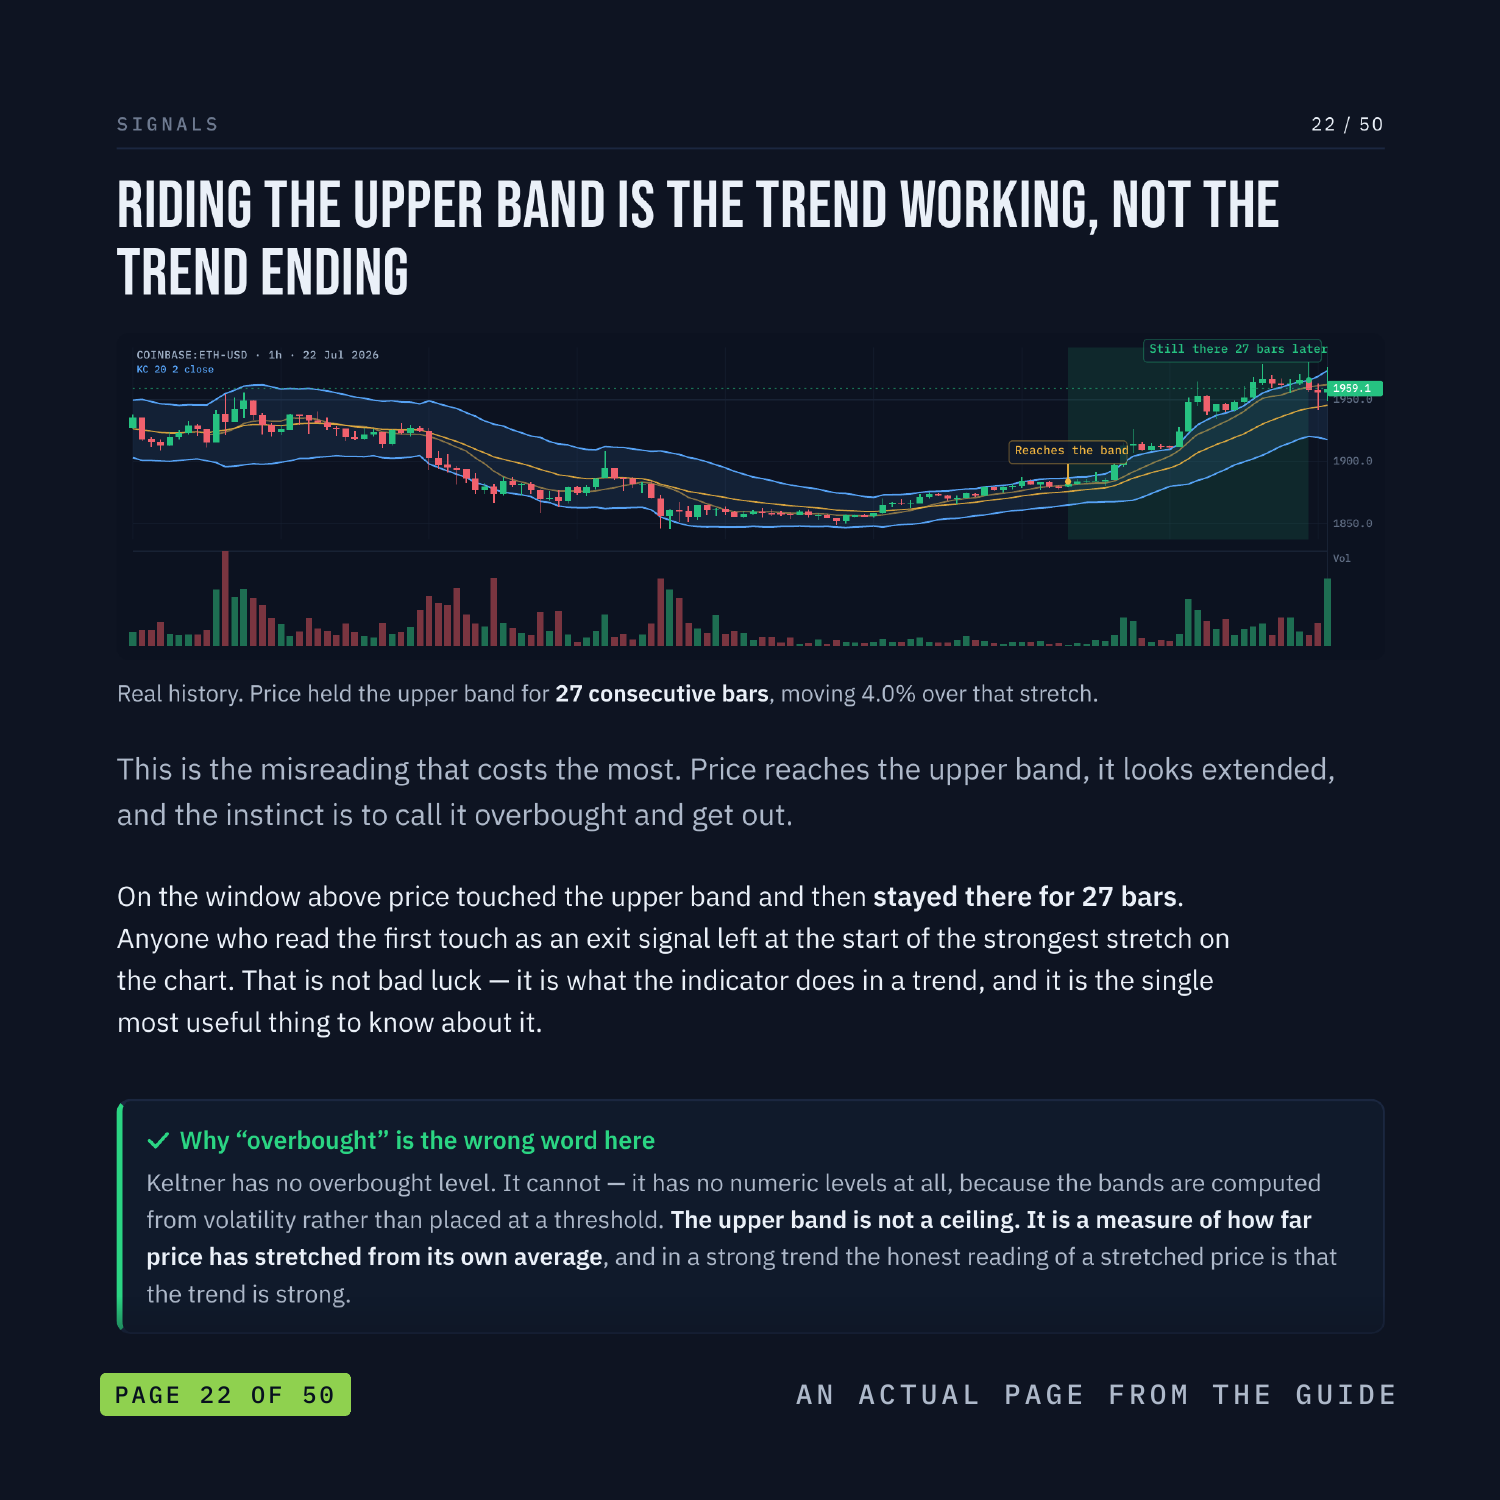
- Why riding the upper band is not overbought - the most expensive misreading of this indicator, shown on a real window where price held the band for many bars.
- The pullback-to-basis entry - the continuation setup with an explicit invalidation, and an honest count of how often it appeared rather than a hit rate.
- Keltner against Bollinger Bands - average true range versus standard deviation, why they disagree exactly when volatility spikes, with both computed on one chart.
- When it does not work at all - flat basis, price crossing it repeatedly, the market where the band-riding read is precisely backwards.
WHAT YOU'LL BE ABLE TO DO
- Load the right indicator, not the Strategy version listed above it.
- Name every line on the screen and what the fill between them means.
- Change the width without touching the middle line, and know why.
- Read a band touch as trend information instead of an exit signal.
- Take a pullback-to-basis entry with a stop that has a reason.
- Say which of Keltner or Bollinger suits the market in front of you.
AN HONEST NOTE
Keltner Channels is a clue, not a crystal ball. It describes what price has already done. This guide contains no win-rates, no backtest results and no promises about what you will make, because nobody can verify those and you should not trust anyone who prints them. What it hands you instead is a set of rules you can test yourself on TradingView in an afternoon. Educational, not financial advice.
Instant download. 50 pages, PDF.