







Ichimoku Cloud Explained — Measured (PDF Guide)
Ichimoku is the only common indicator that draws part of itself in FRONT of the last candle, and that one design choice does more work on a beginner than any amount of marketing. A shape sitting ahead of price looks like a statement about what is coming. It is not one, and almost nothing written about the tool says so plainly.
This guide takes the five lines apart, shows exactly which bars each one was computed from, and then measures the two entries people actually take. The displacement turns out to be the most important thing about the indicator and the least explained. This is a 46-page PDF that teaches Ichimoku Cloud from the first thing you see on the screen through to a written strategy with an entry, a stop and an explicit rule for when the trade is wrong.
Nothing is taught underneath a chart. Every label sits on the candle, the line or the level it is describing, on real BTC, ETH, SOL and LINK charts. There are three quizzes on real charts, each followed by the same chart re-shown annotated with the reasoning, plus faded practice pages where the first steps are filled in and you finish the rest.
WHAT'S INSIDE
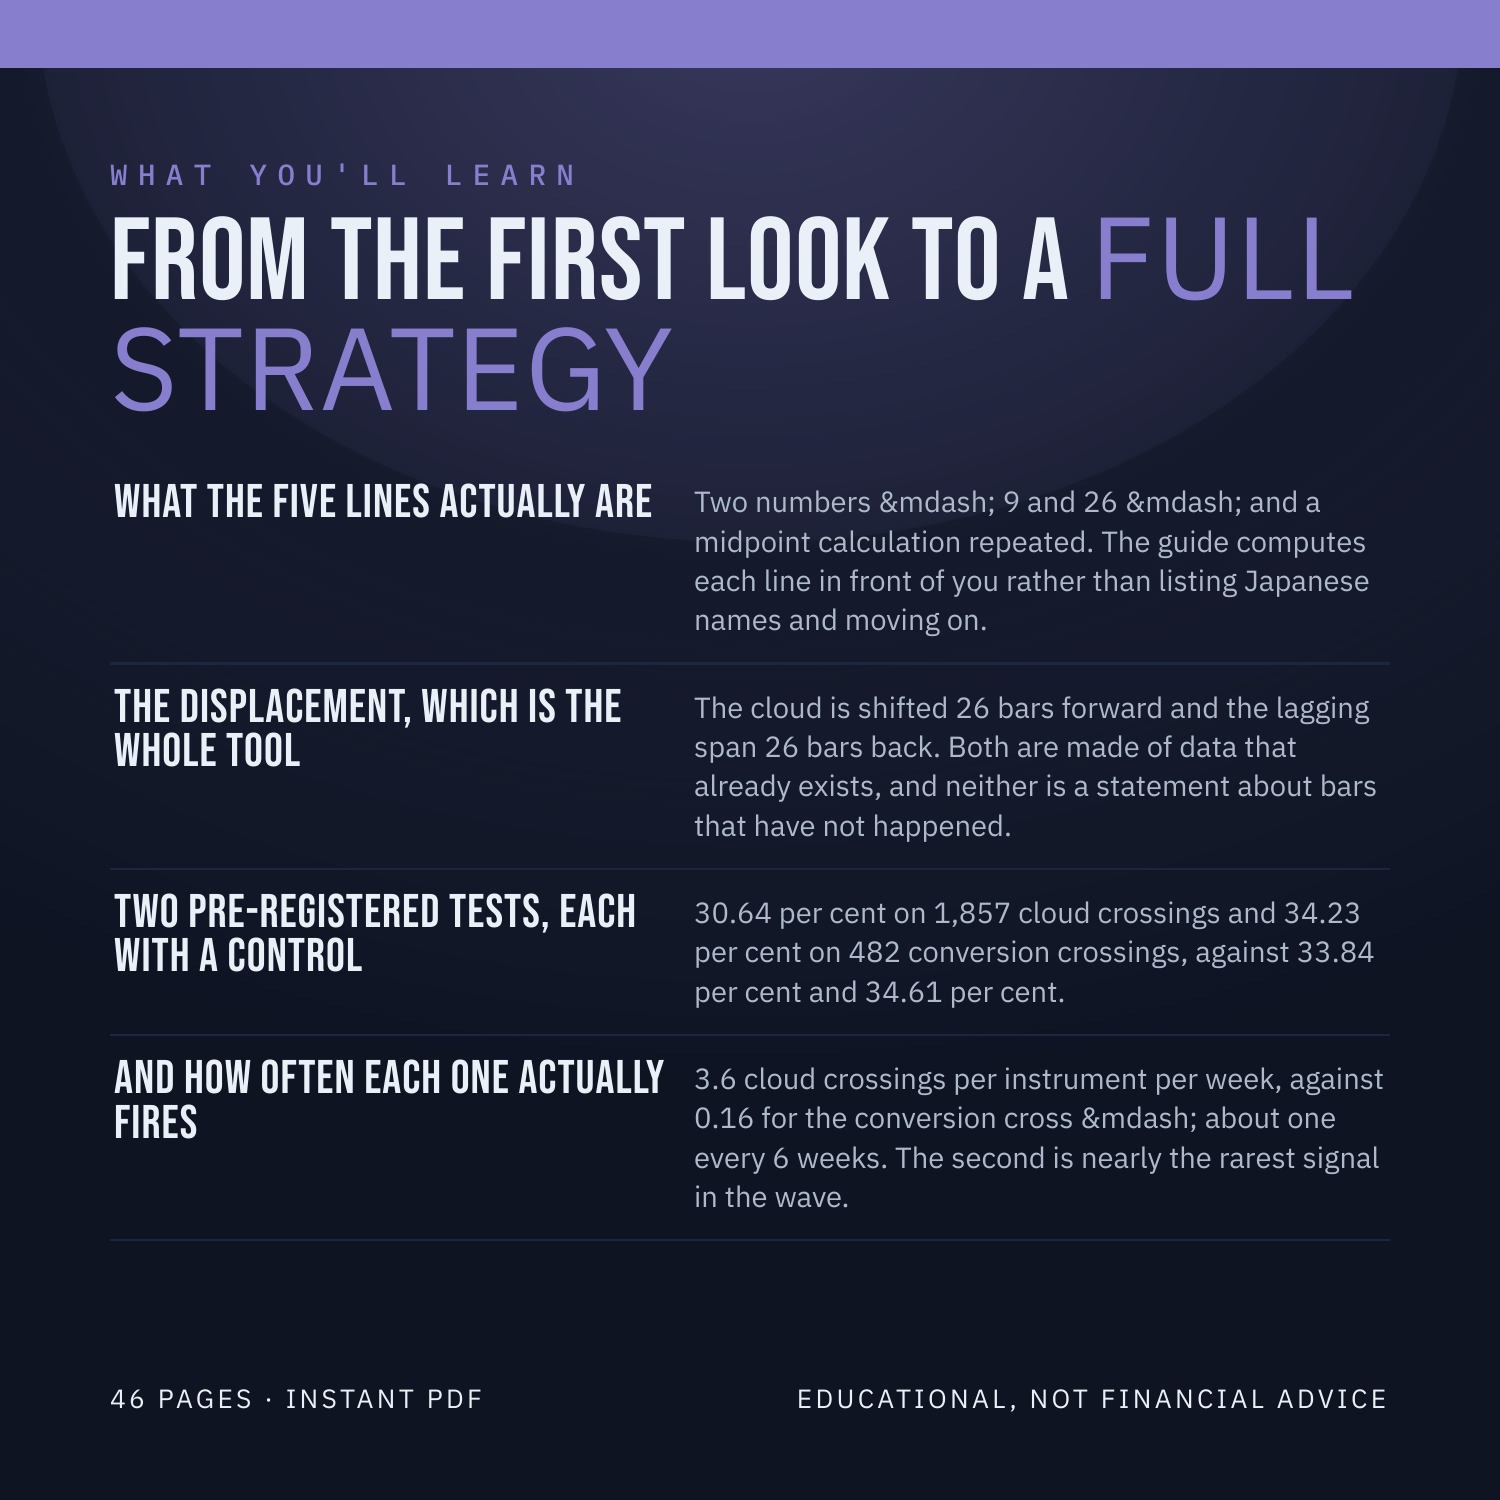
What the five lines actually are -- Two numbers -- 9 and 26 -- and a midpoint calculation repeated. The guide computes each line in front of you rather than listing Japanese names and moving on.
The displacement, which is the whole tool -- The cloud is shifted 26 bars forward and the lagging span 26 bars back. Both are made of data that already exists, and neither is a statement about bars that have not happened.
Two pre-registered tests, each with a control -- 30.64 per cent on 1,857 cloud crossings and 34.23 per cent on 482 conversion crossings, against 33.84 per cent and 34.61 per cent.
And how often each one actually fires -- 3.6 cloud crossings per instrument per week, against 0.16 for the conversion cross -- about one every 6 weeks. The second is nearly the rarest signal in the wave.
WHAT YOU'LL BE ABLE TO DO
Compute all five Ichimoku lines from a price series yourself.
Say which bars each line was made from, and where it is drawn.
Explain why a line drawn ahead of price is not a forecast.
Quote what both standard entries paid against a control.
Tell a rare signal from a good one, using the firing rate.
AN HONEST NOTE
Ichimoku Cloud is a clue, not a crystal ball. It describes what price has already done. This guide contains no win-rates, no backtest results and no promises about what you will make, because nobody can verify those and you should not trust anyone who prints them. What it hands you instead is a set of rules you can test yourself on TradingView in an afternoon. Educational, not financial advice.
Instant download. 46 pages, PDF.