






How to Use the Stochastic Oscillator — A Visual Guide for Traders
The stochastic makes new traders feel like they found a cheat code, right up until it costs them. It flashes oversold, they buy, price keeps dropping. It flashes overbought, they short, the trend runs them over. The signal was fine. It was pointed at the wrong kind of market.
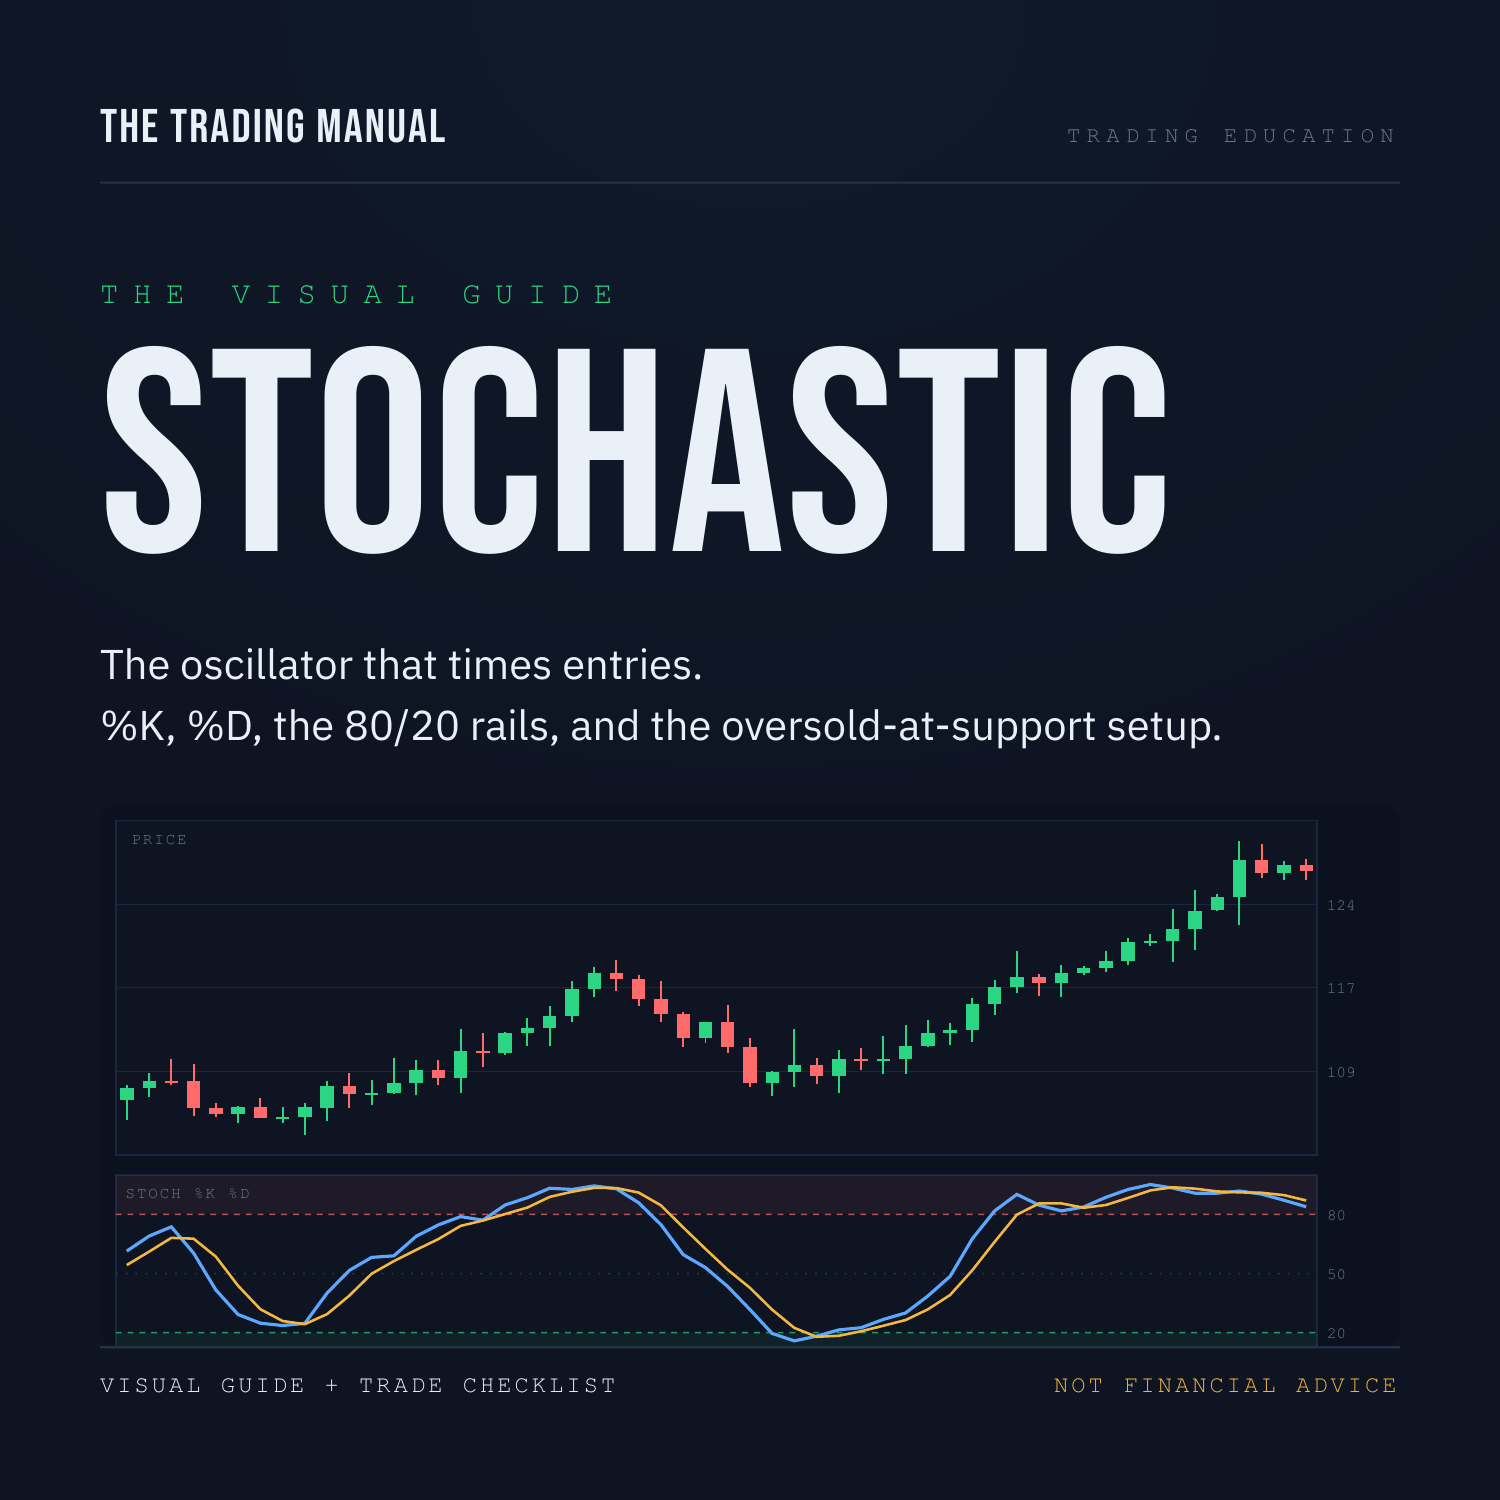
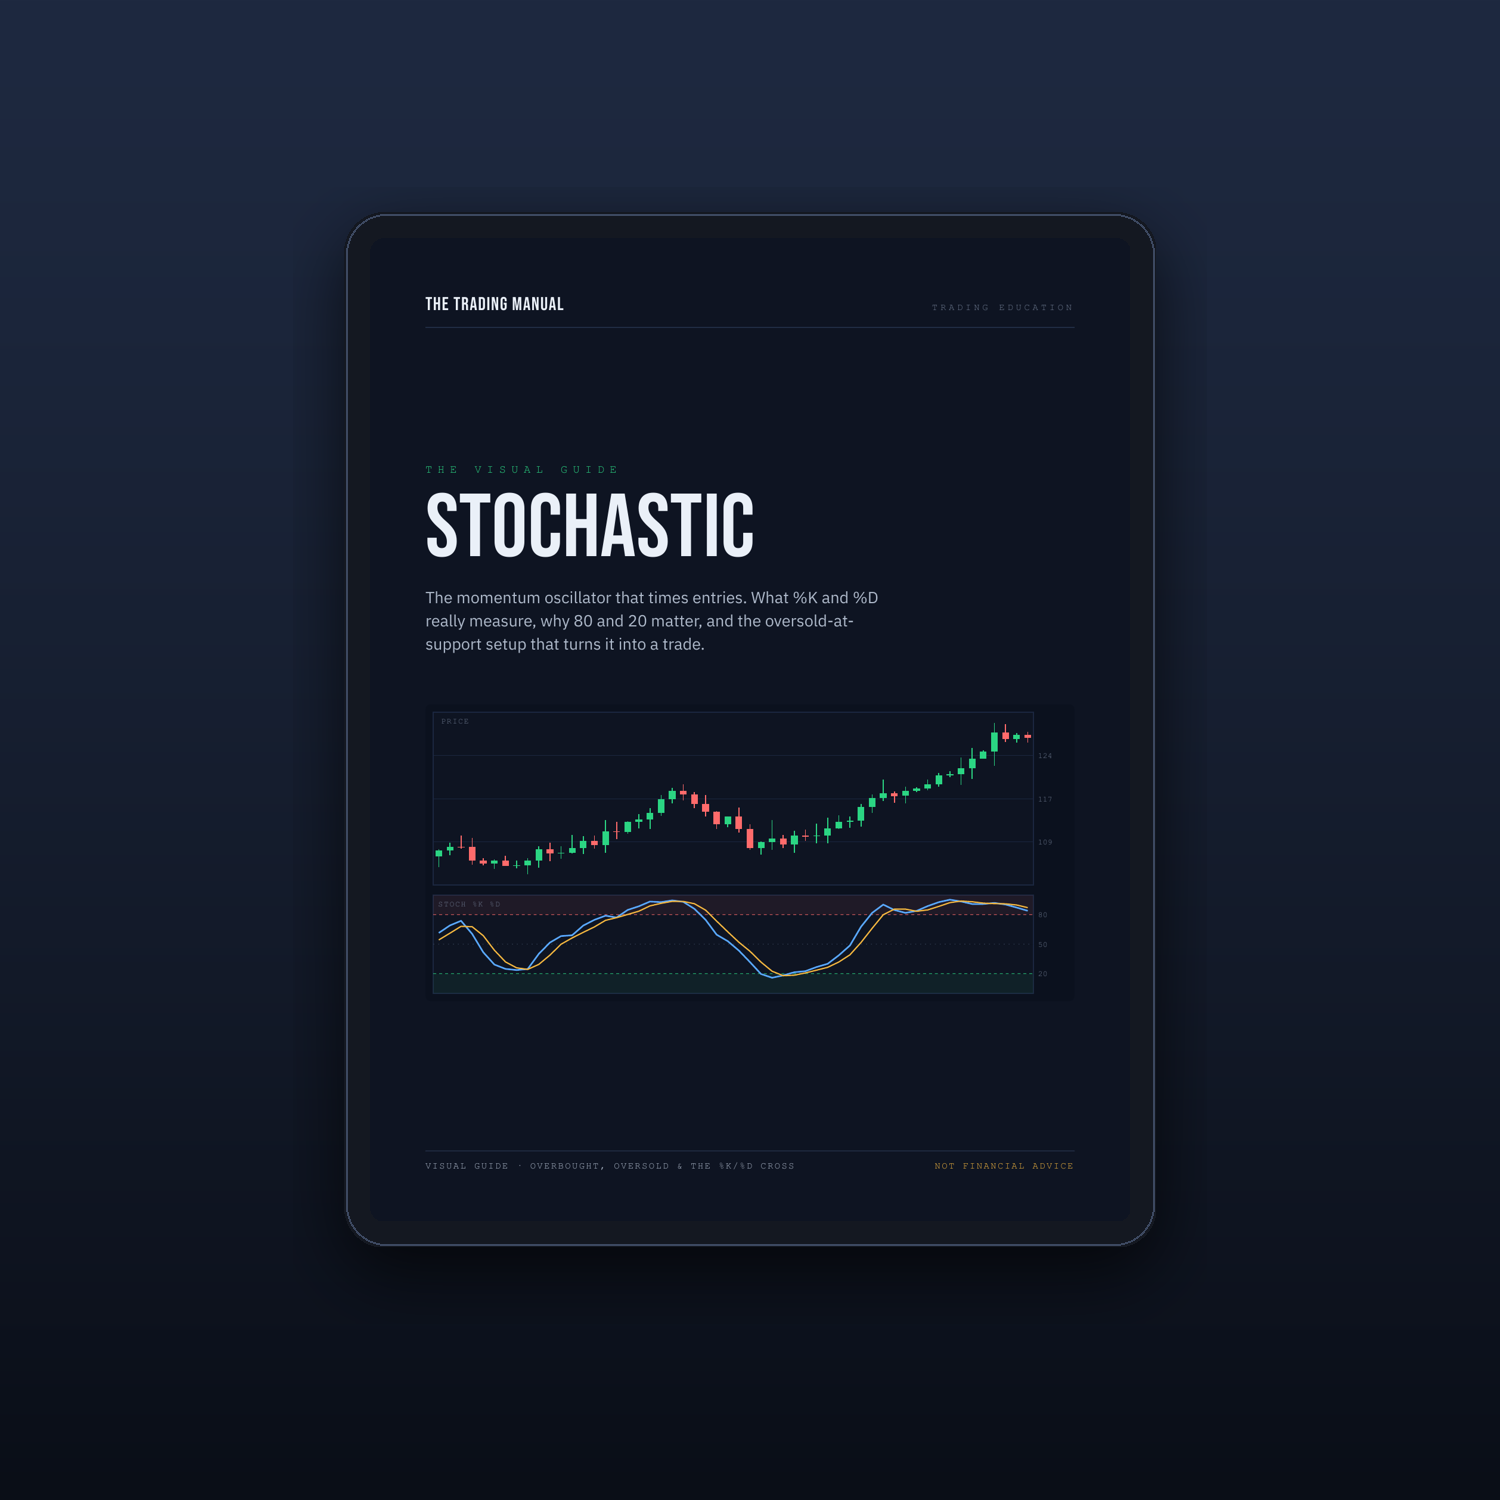
This visual guide fixes the aim. In 16 clean pages you will learn what the stochastic actually measures, why 80 and 20 are not buy and sell buttons, and the specific setup that turns it from a noisy oscillator into a timing tool.
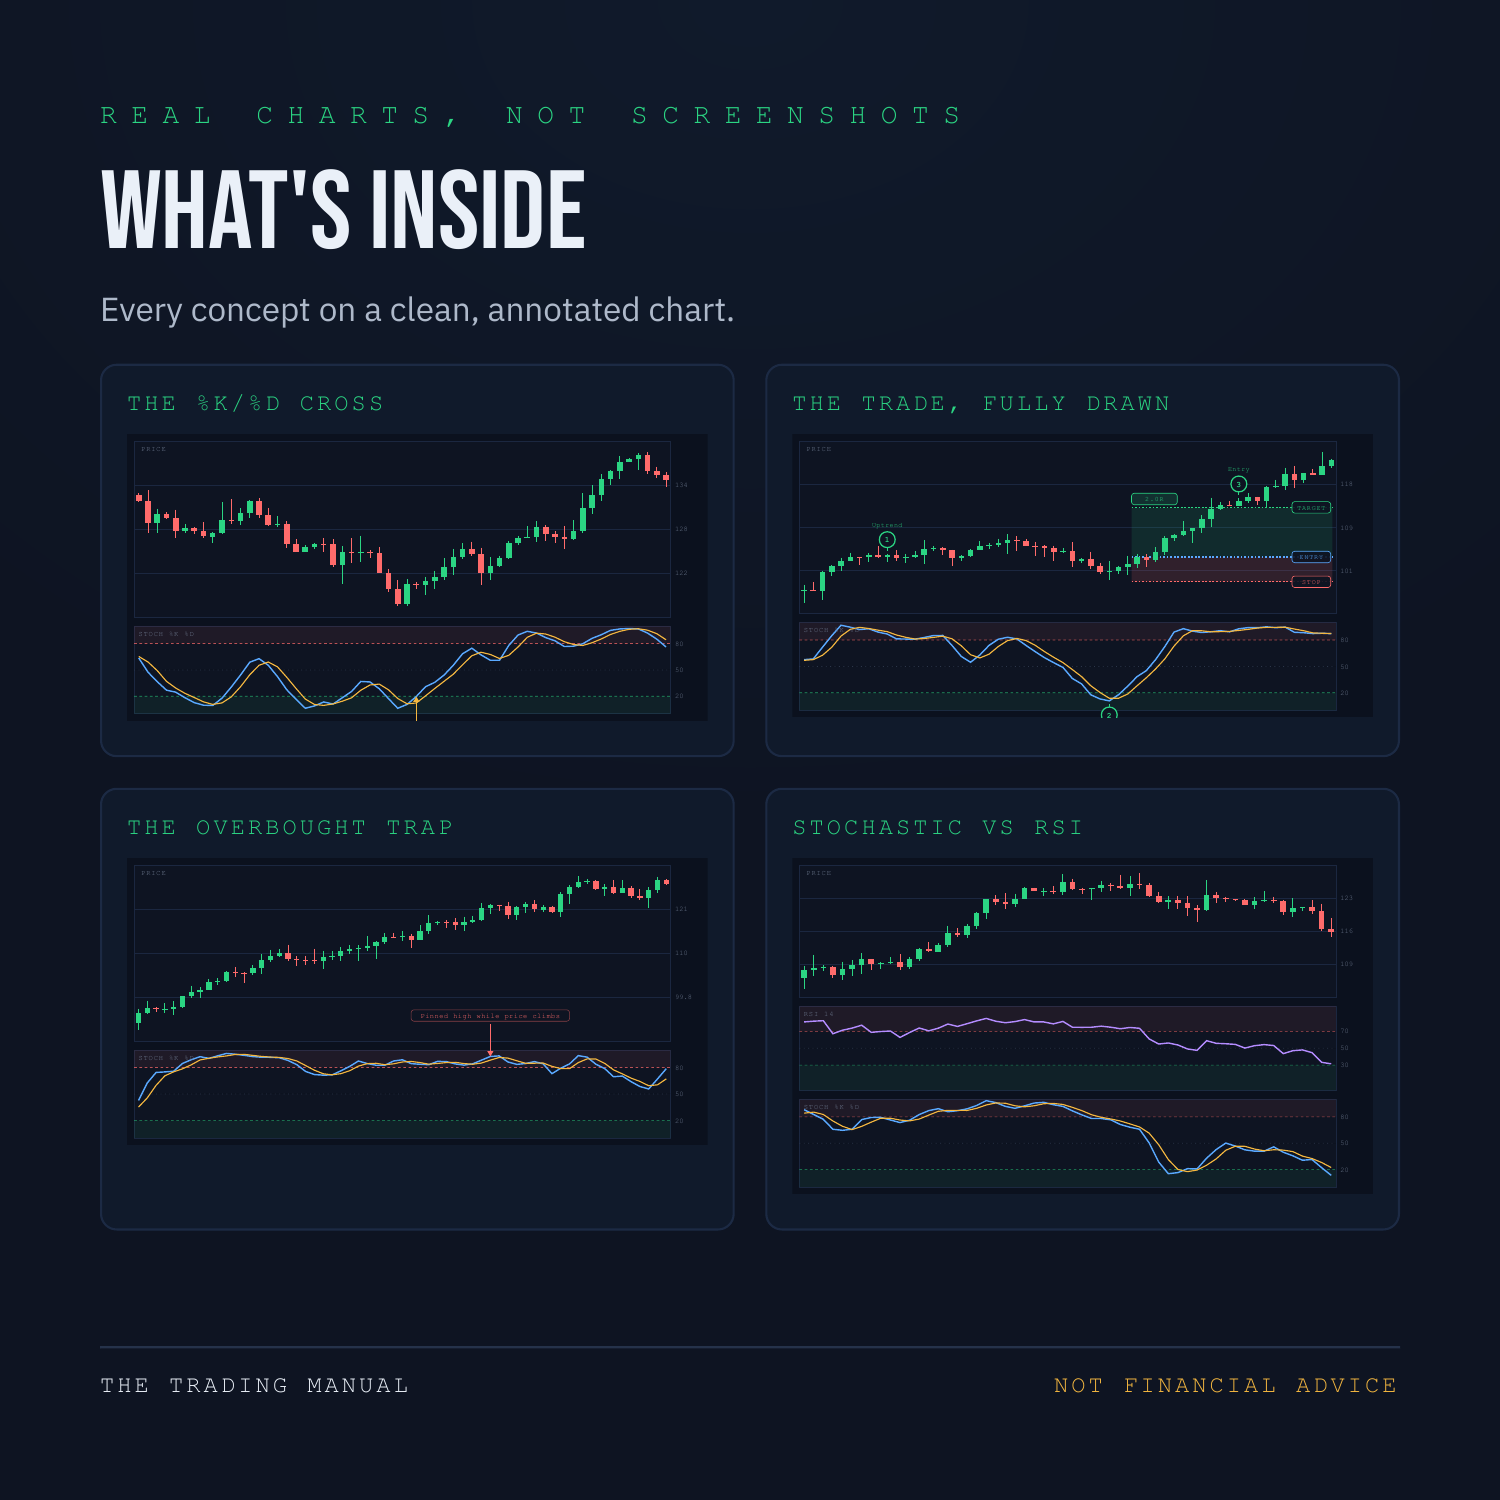
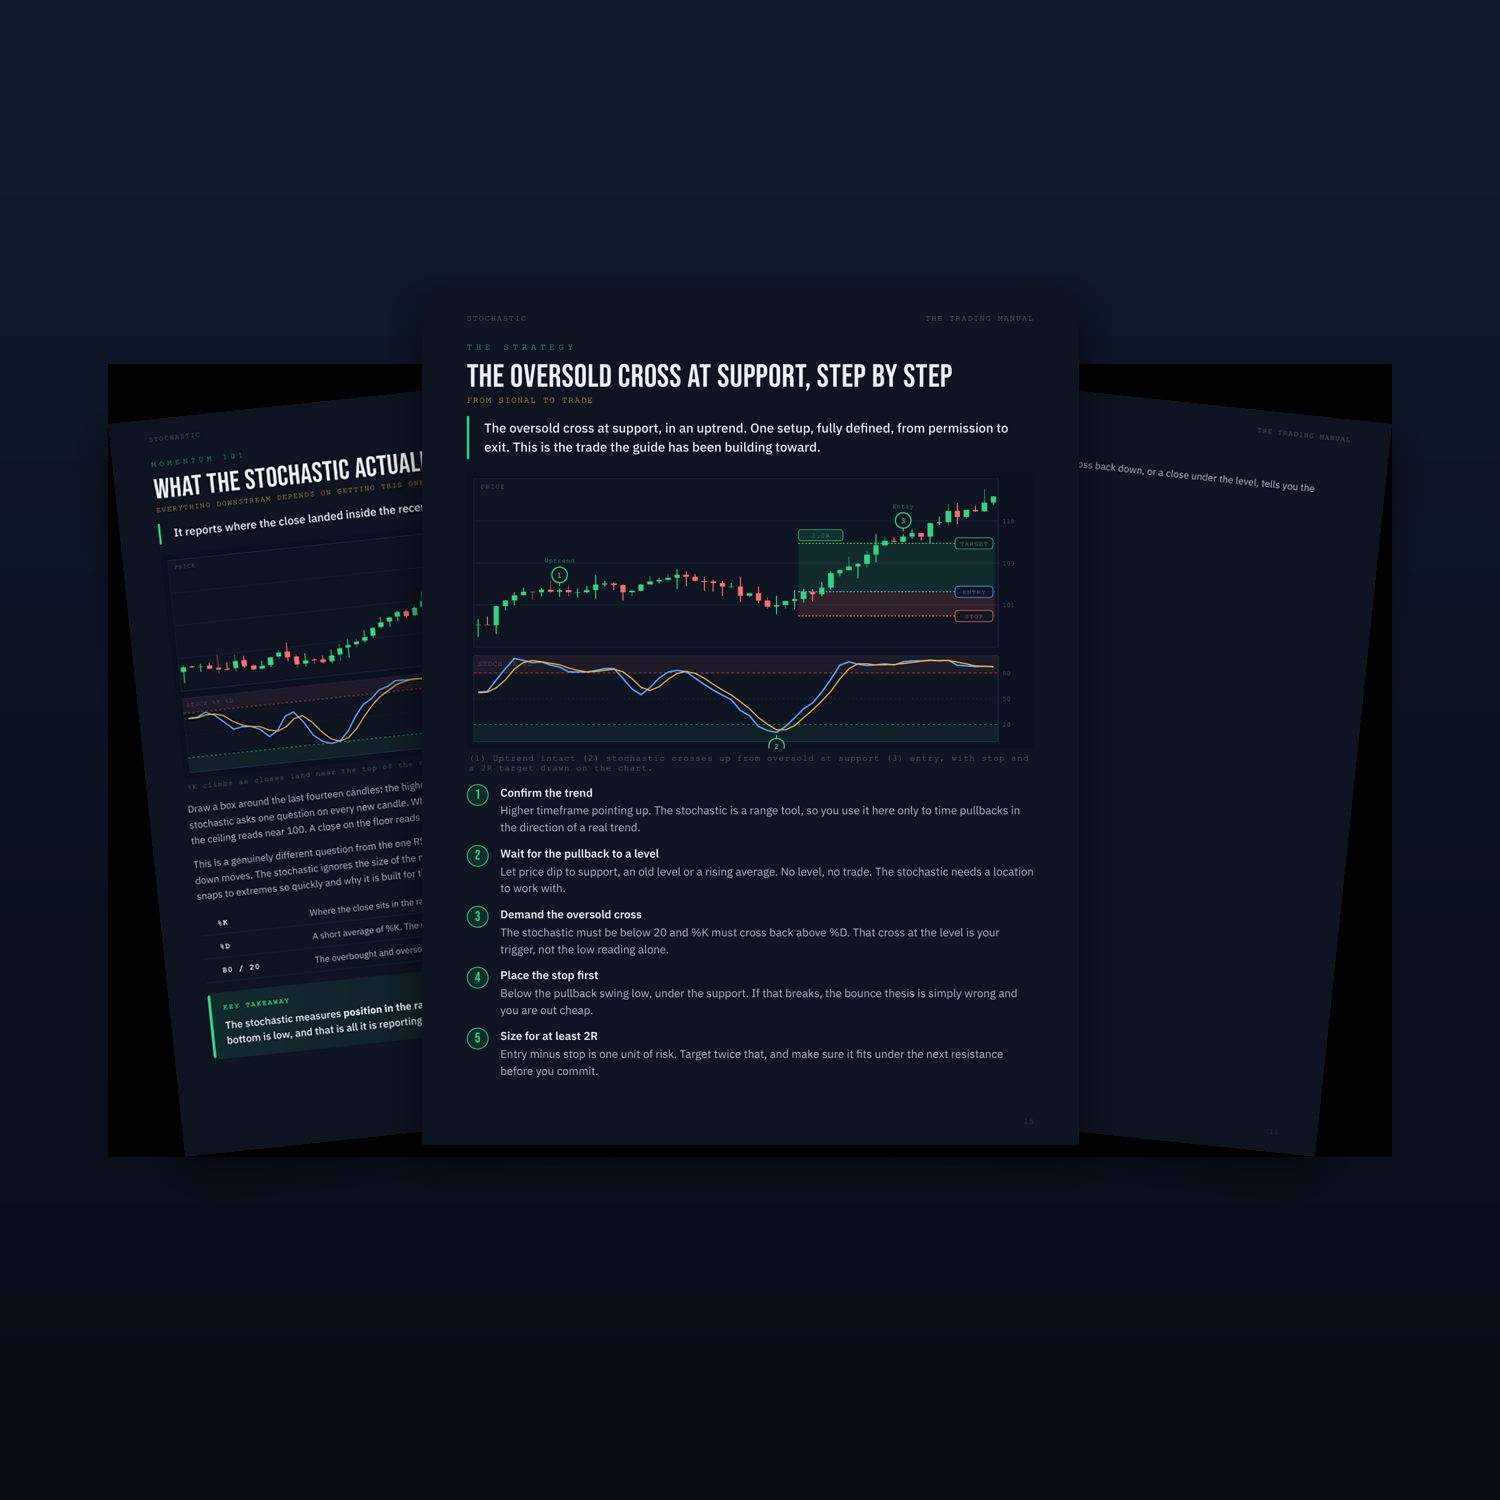
Every concept is taught on a hand-built, annotated chart with arrows and numbered steps pointing at exactly what matters. You will see the %K/%D crossover, the overbought trap, divergence, and a side-by-side of the stochastic against RSI. It ends with a full playbook: the oversold-cross-at-support trade drawn on a chart with entry, stop, and target marked, plus a checklist you run live before every entry.
**What's inside:**
- What the stochastic really measures: position in the range, not the size of the move
- The 80/20 rails and why they are stricter than RSI's 70/30
- The %K and %D crossover, the signal that makes it a timing tool
- All three real settings explained: %K length, %K smoothing, %D smoothing
- Divergence, range vs trend, and how the stochastic differs from RSI
- The oversold-cross-at-support strategy, drawn on the chart, plus a live checklist
**What you'll be able to do:**
- Read the stochastic as location, not speed
- Trade the crossover inside a zone instead of the bare reading
- Time an oversold cross at support with a defined stop and 2R target
The stochastic is a clue, not a crystal ball. This guide is educational, not financial advice.
Instant PDF download. Pairs perfectly with the RSI and Moving Averages guides in the store.