








Subscription Business Metrics Dashboard — Ready-to-Use Digital Toolkit
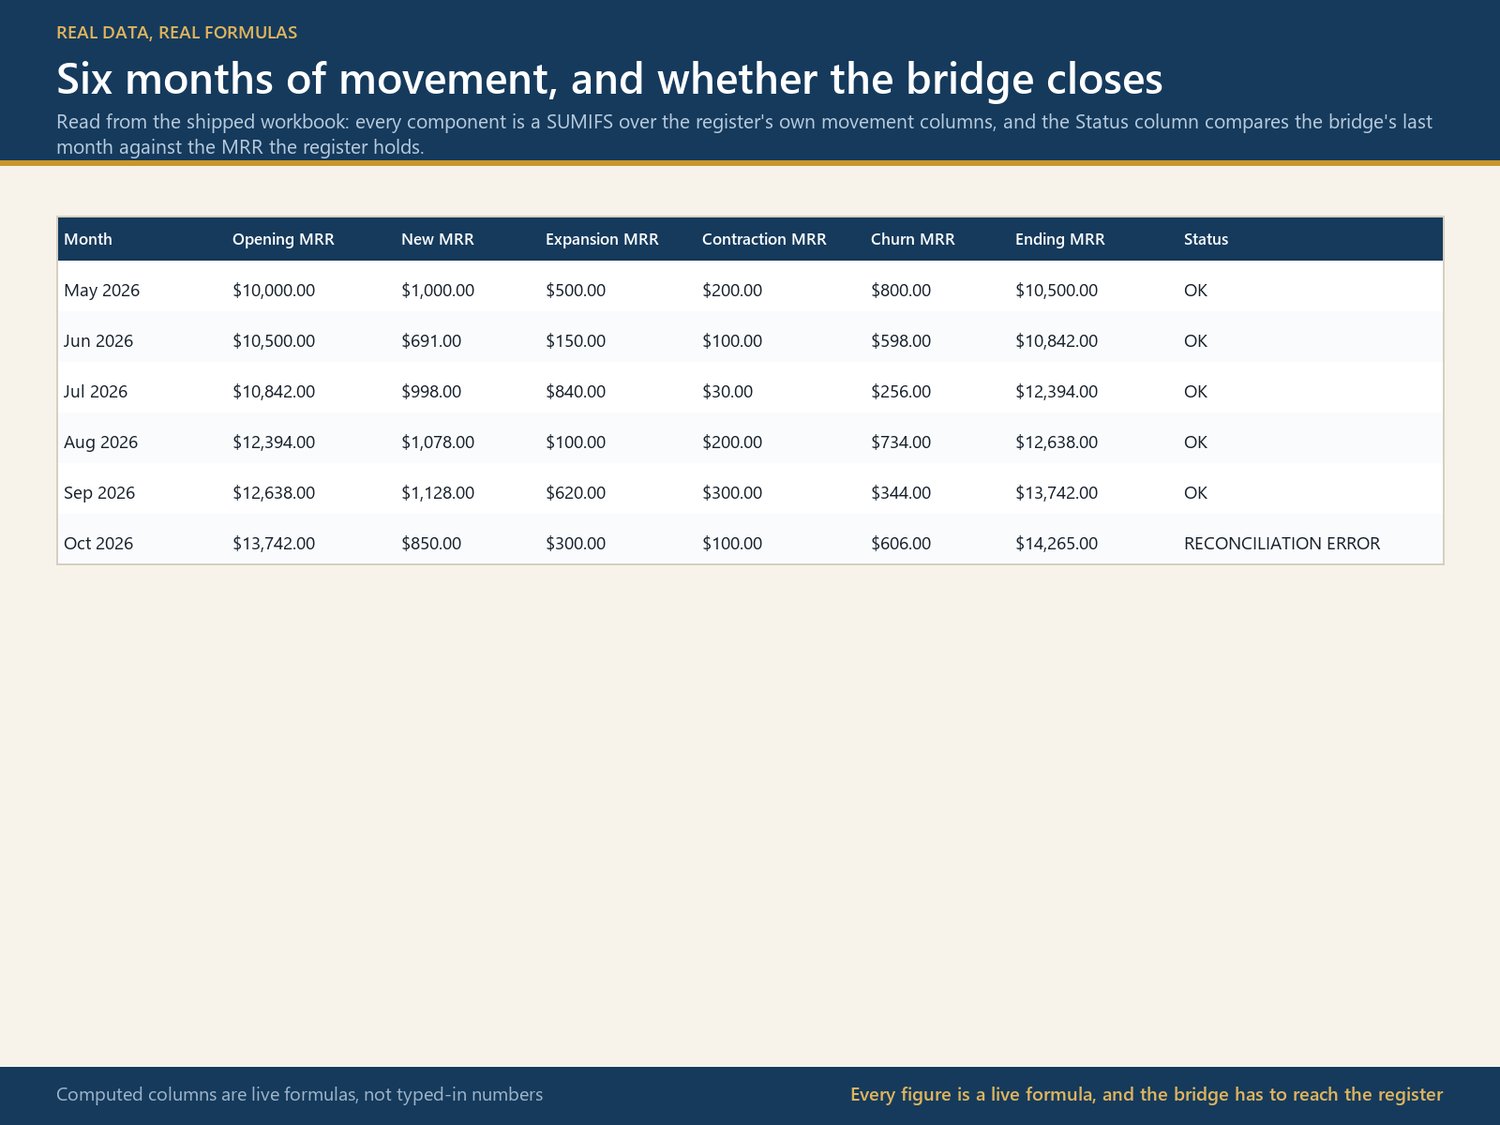
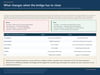
MRR changed. Can you explain why—and prove the bridge reconciles?
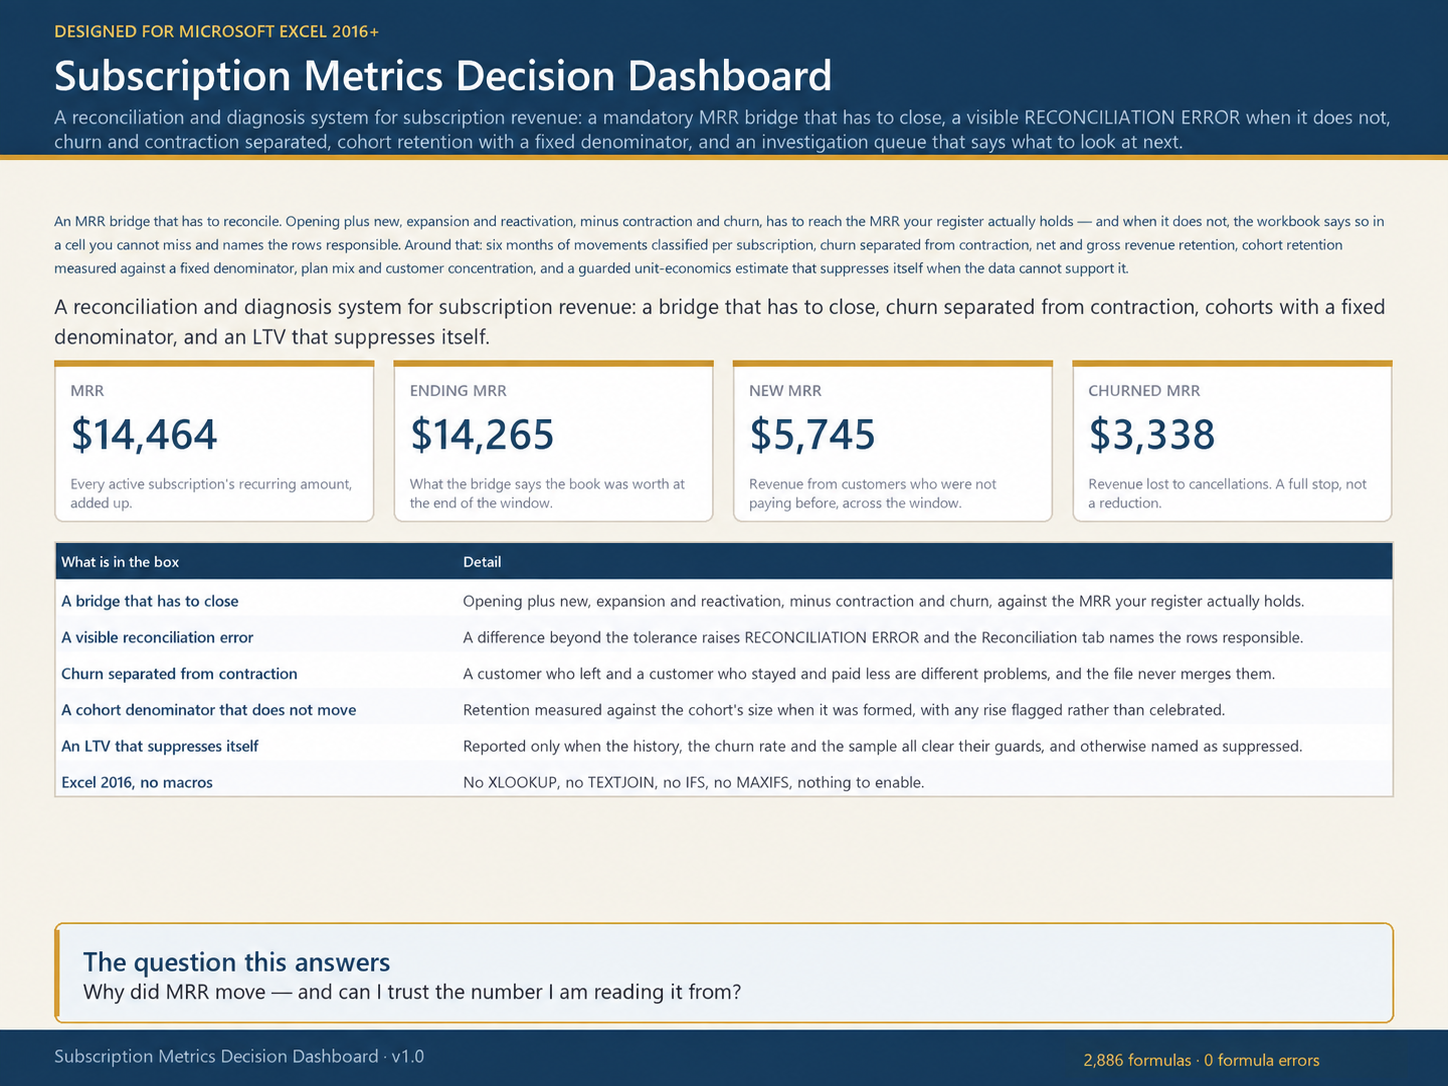
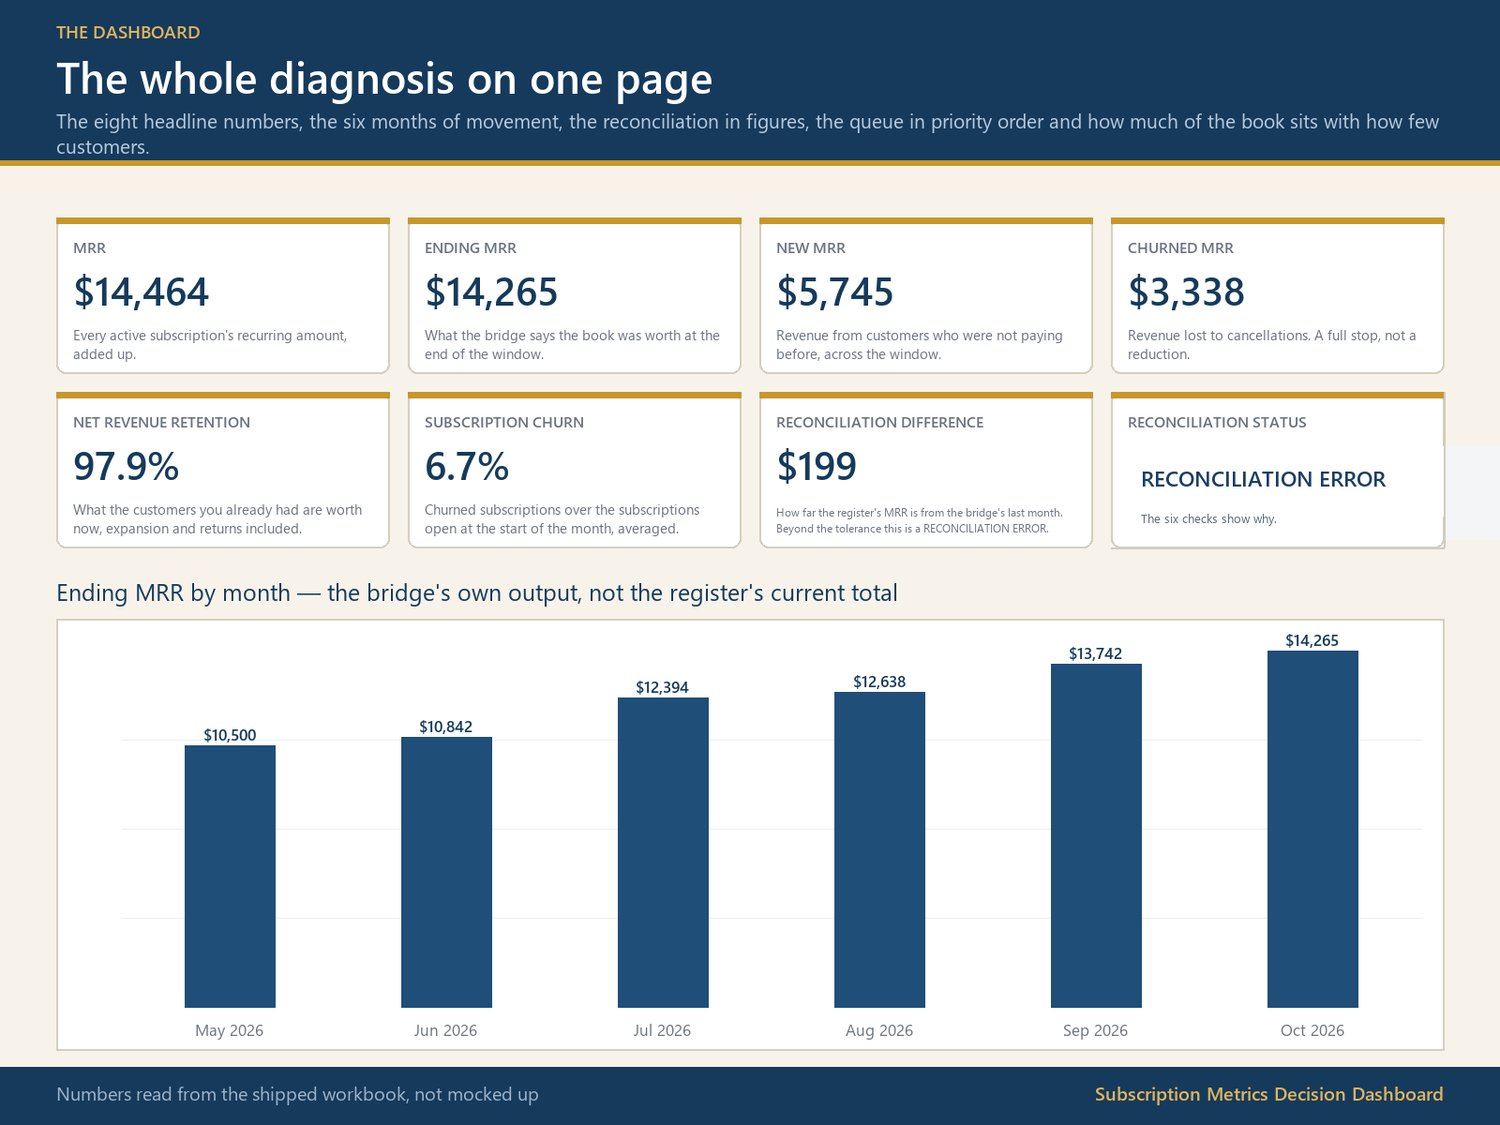
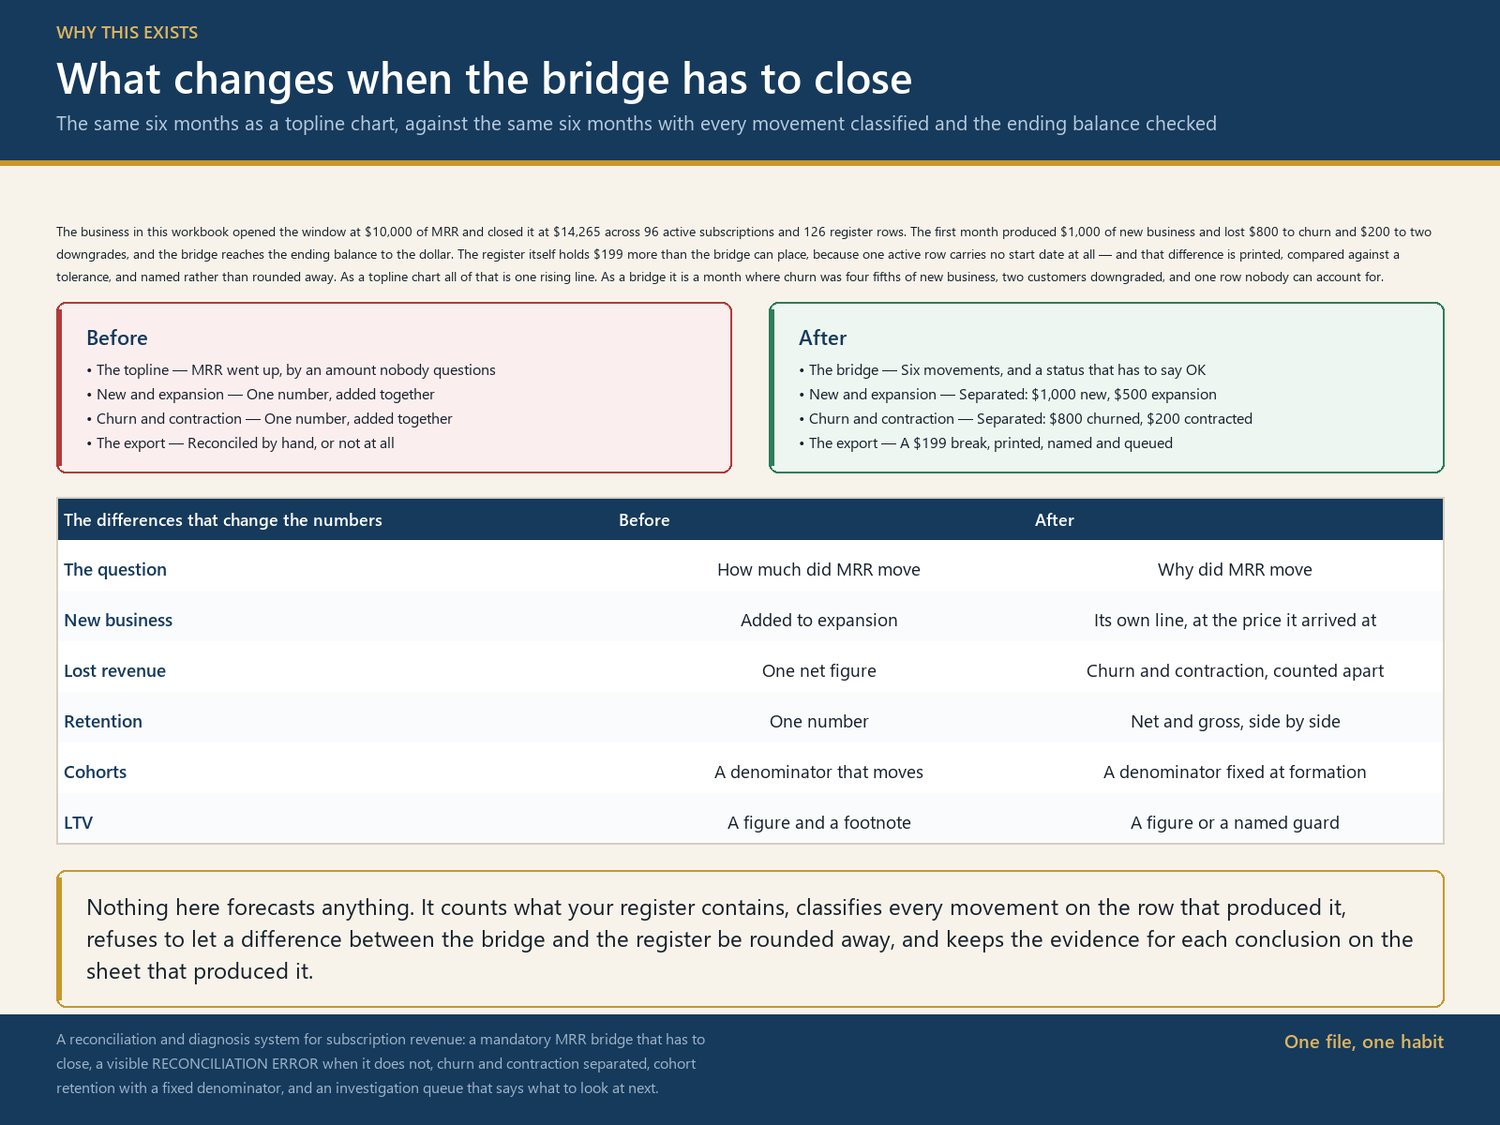
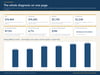
For SaaS founders, subscription operators, and finance or RevOps teams, this workbook turns a billing export into a visible monthly diagnosis. It separates new business, expansion, reactivation, contraction, and churn, then checks the movement bridge against the register. When the numbers do not agree, it raises a visible RECONCILIATION ERROR and points to an investigation queue.
WHAT IT HELPS YOU DO
• Reconcile opening MRR + new + expansion + reactivation − contraction − churn to ending MRR.
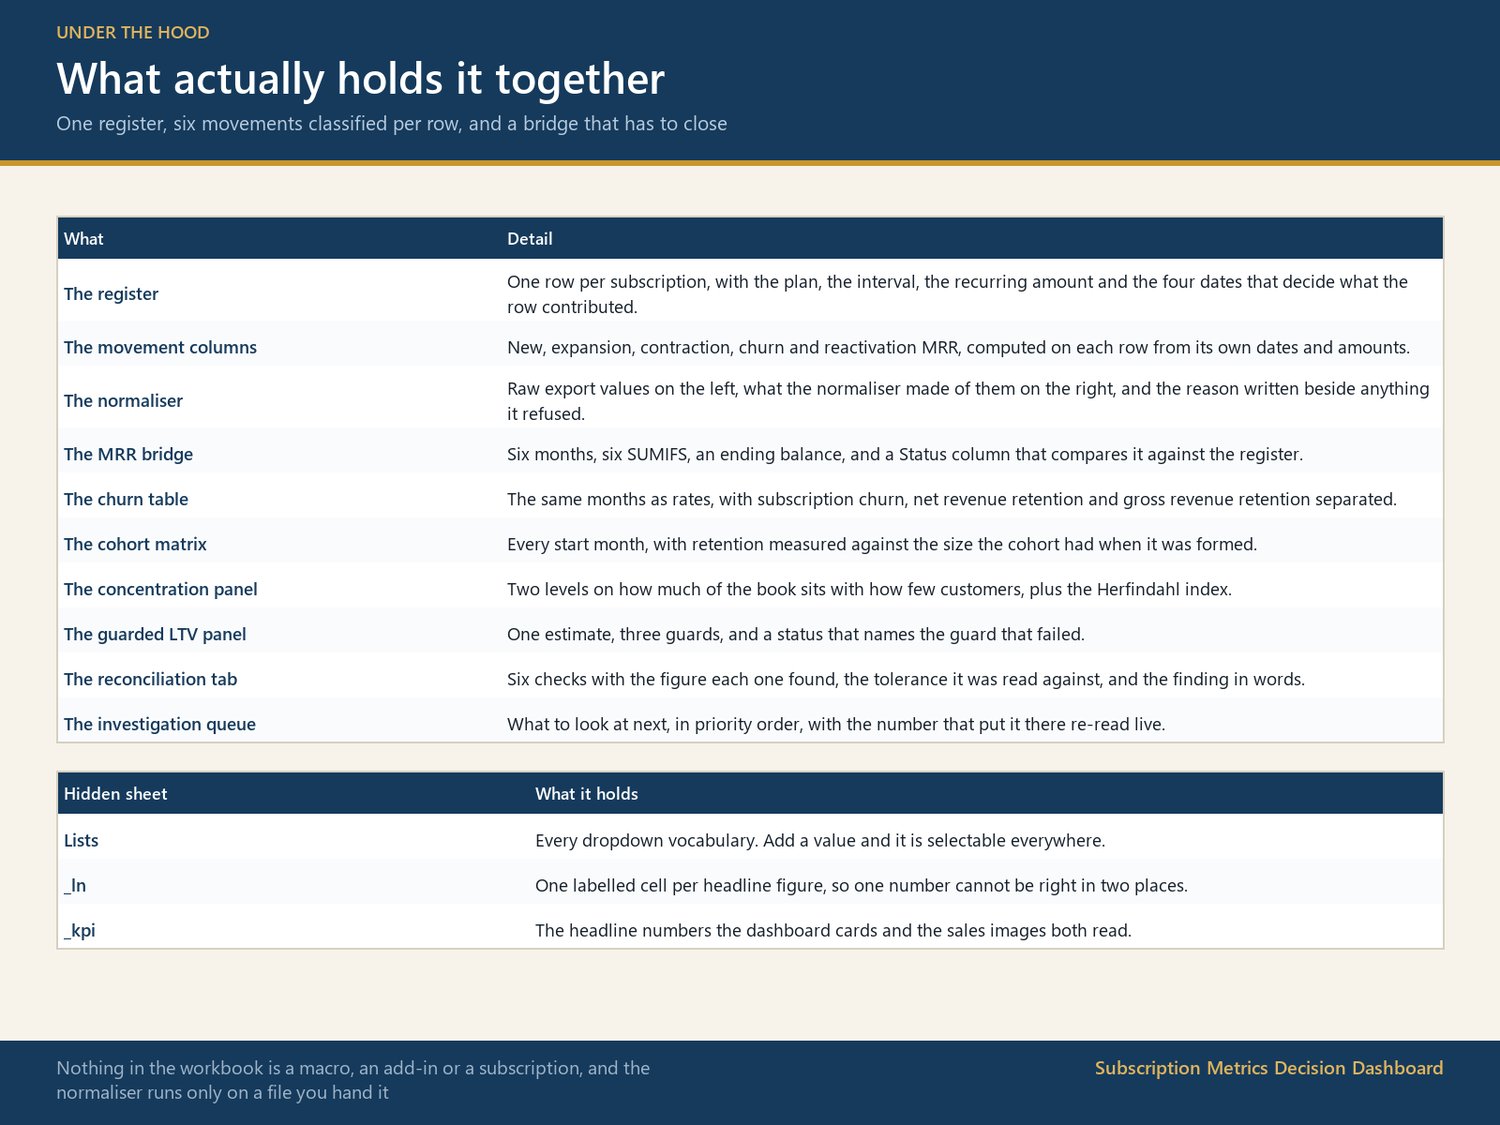
• See movement classifications on the subscription rows that produced them.
• Keep churn separate from downgrades; review net and gross revenue retention.
• Track cohorts with a fixed formation-month denominator and flag unexplained rises.
• Use guarded LTV indicators that suppress unsupported estimates.
• Normalize CSV exports, flag duplicate rows, and hold unfamiliar billing intervals for review instead of guessing.
WHAT’S INCLUDED
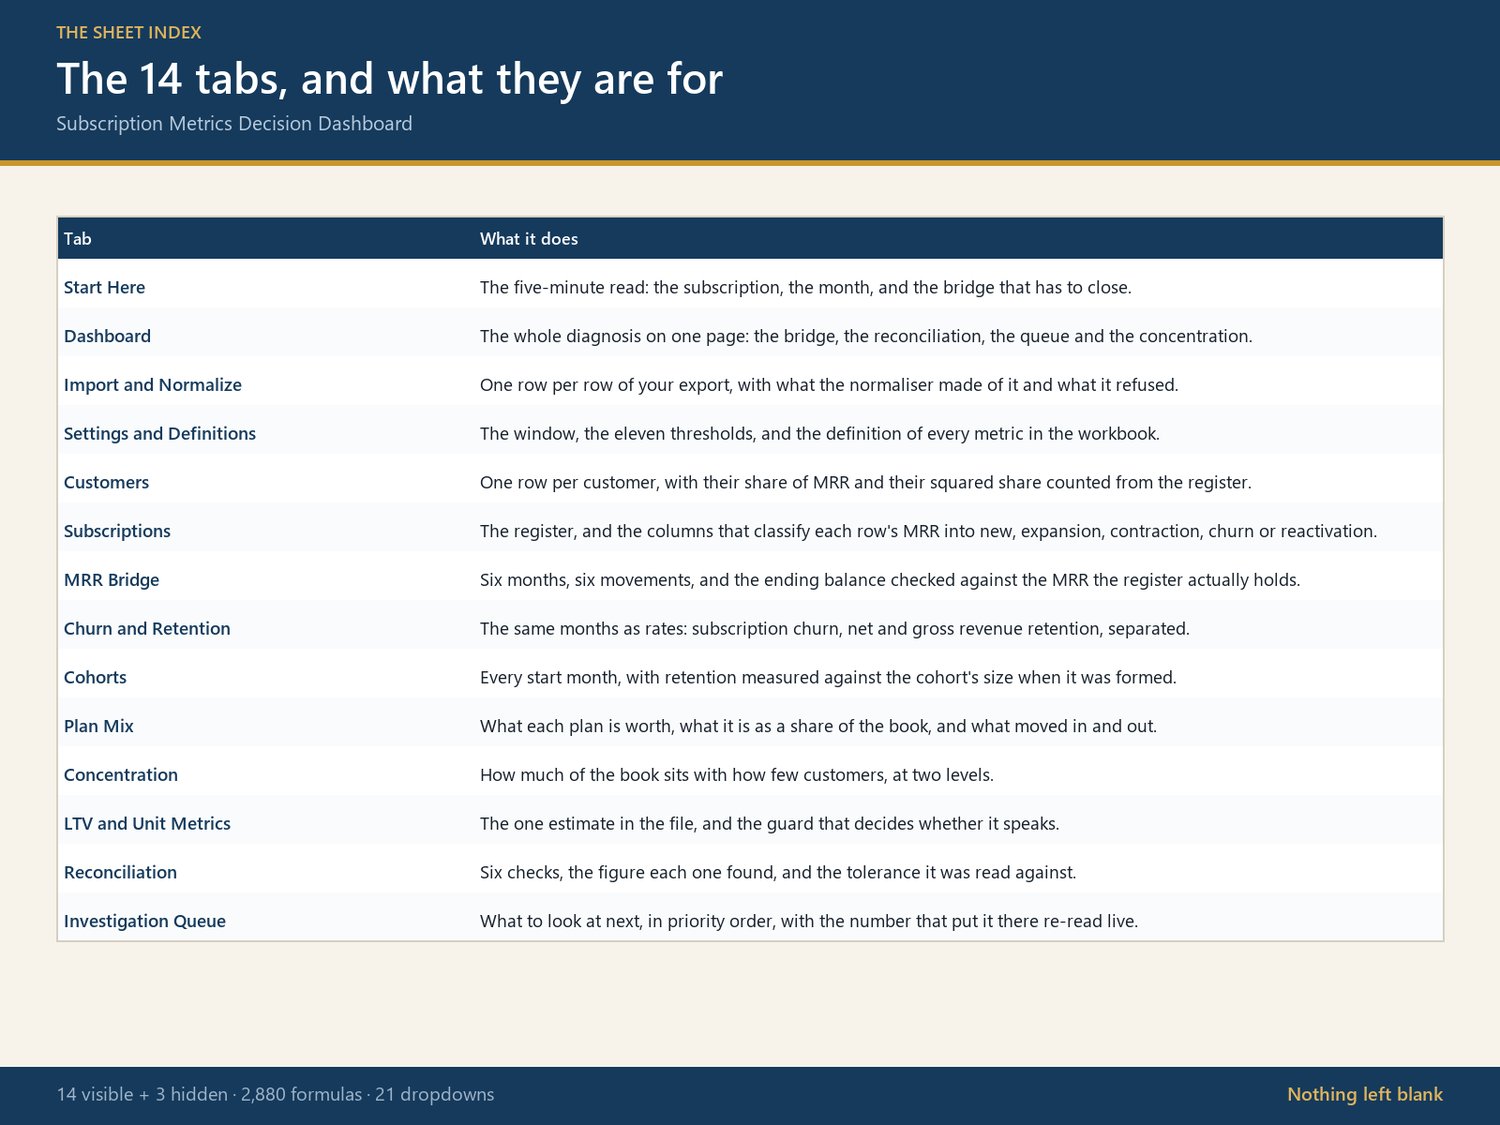
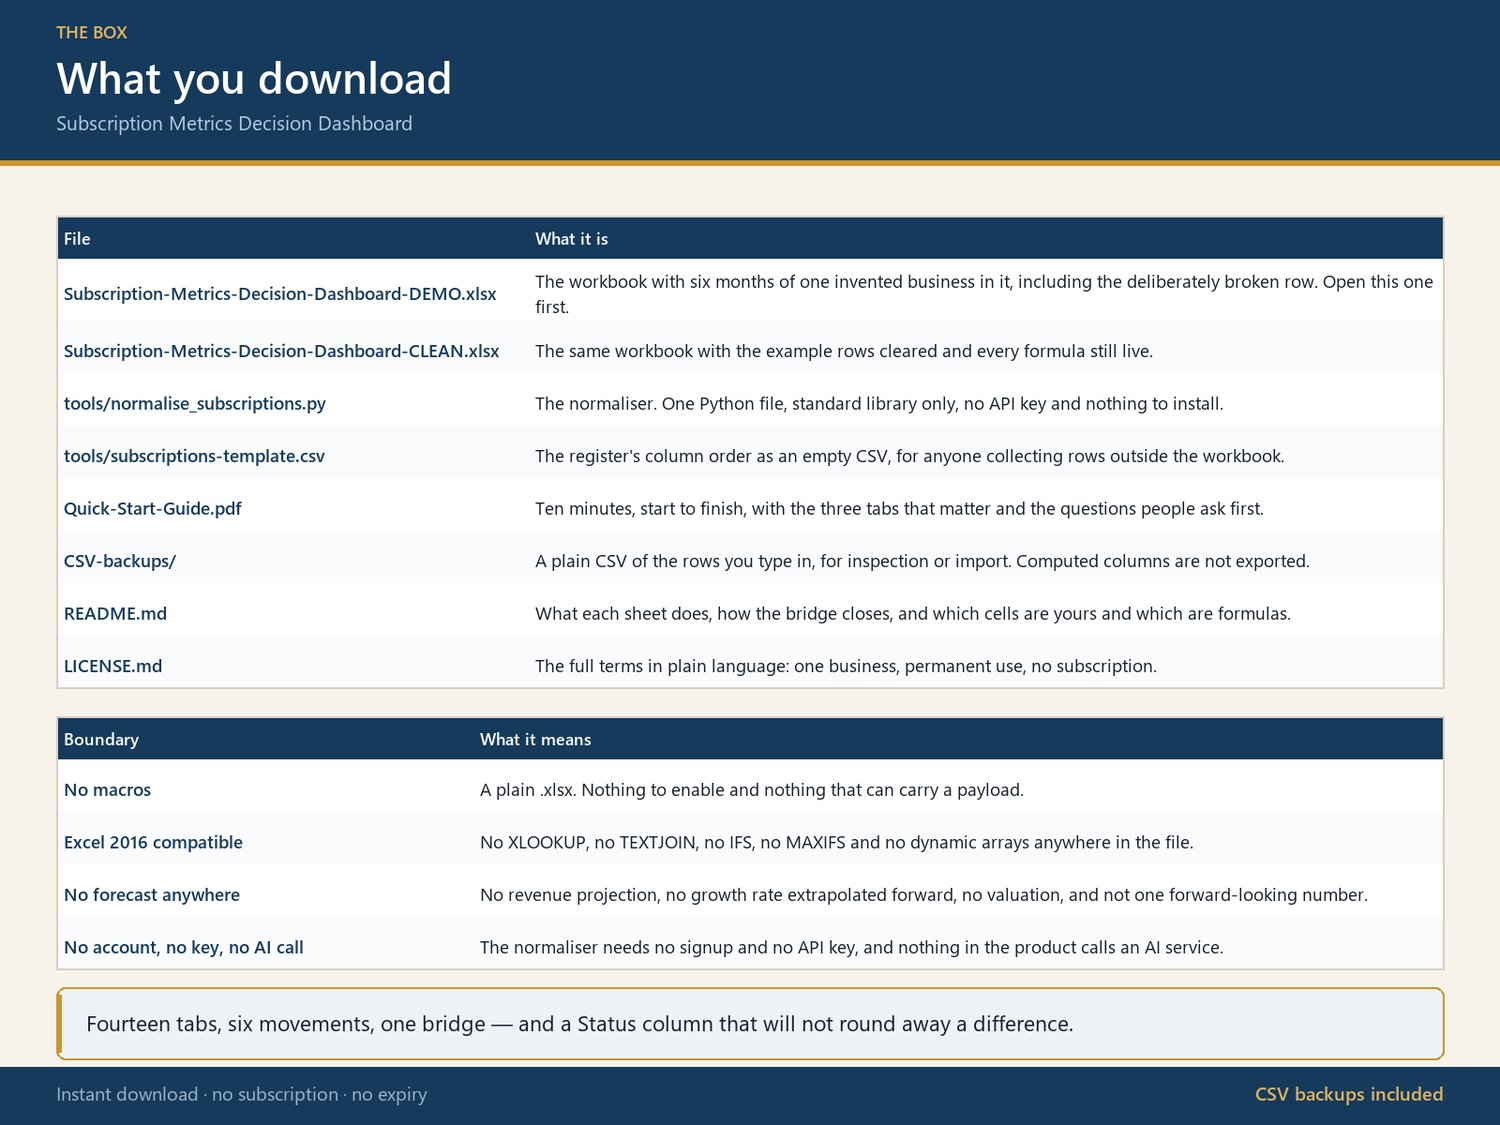
• DEMO and CLEAN 17-sheet Excel workbooks
• Quick Start PDF and CSV import examples
• Standard-library Python CSV normalizer (no paid API or account)
• Importable review/action tables, setup guide, and one-business licence
WORKFLOW & COMPATIBILITY
Export your subscription data as CSV and review it manually in the workbook. This is not a live Stripe/billing integration, forecast, accounting or tax tool, and it does not infer why a customer churned. Intended for Microsoft Excel 2016 or later. Google Sheets, LibreOffice, and Numbers have not been independently verified. No macros, add-ins, internet connection, or AI calls are required.
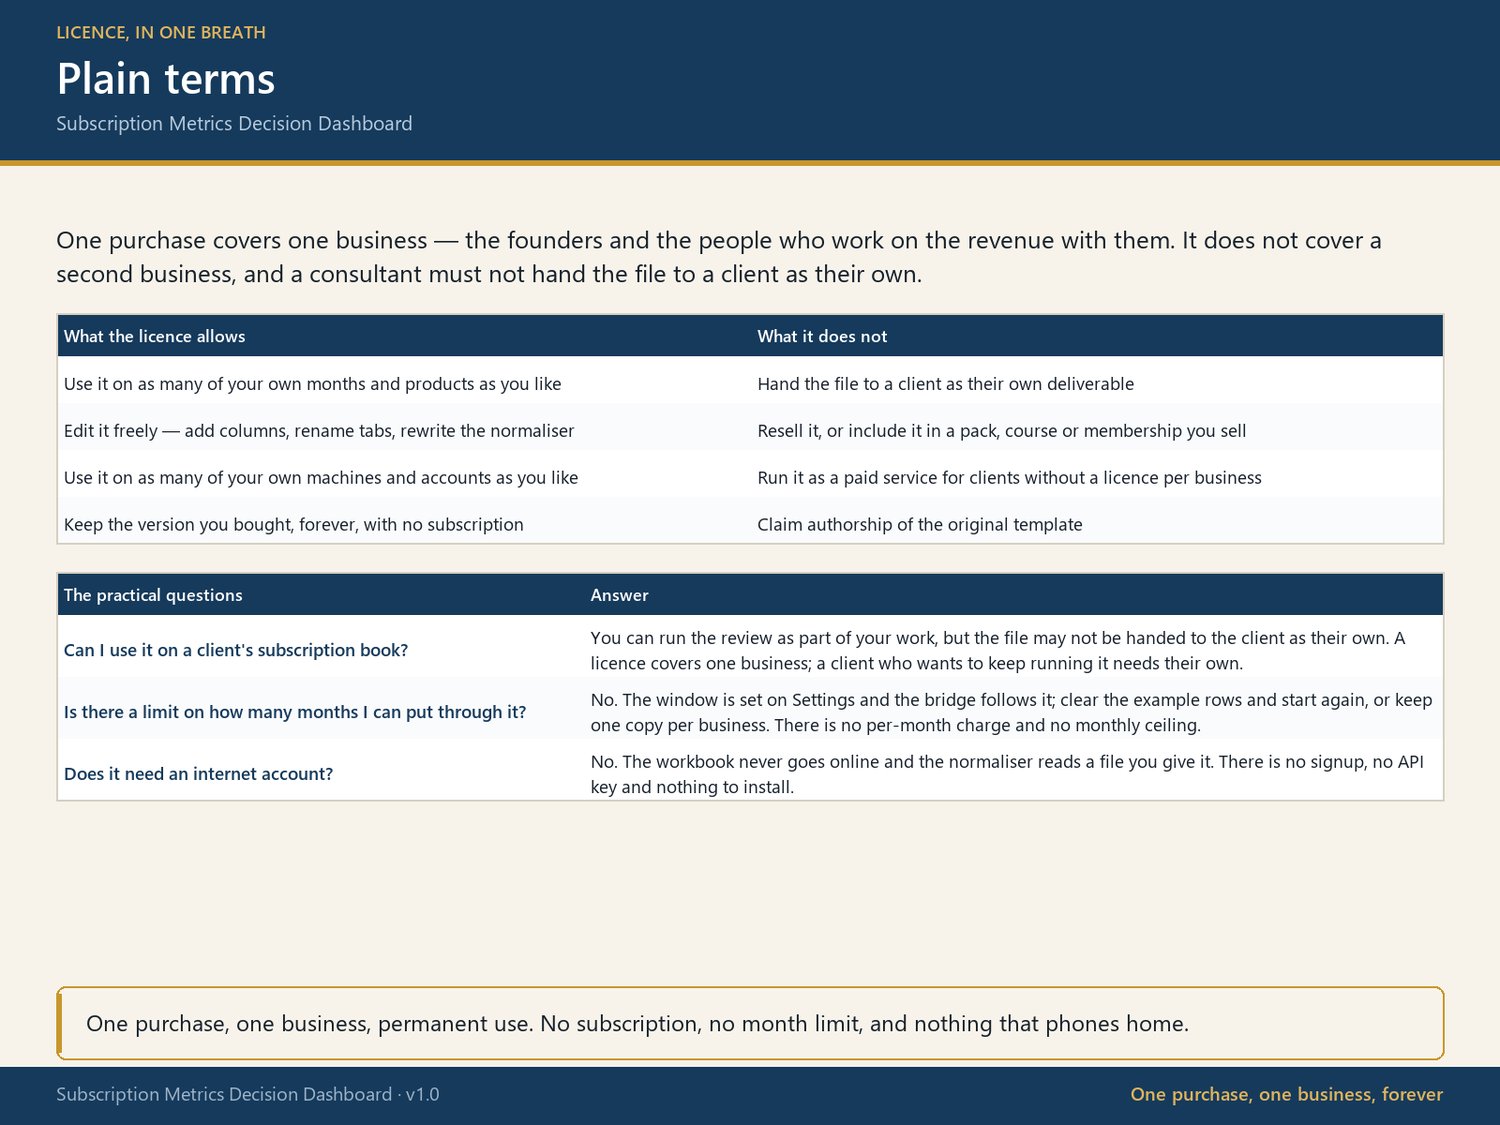
One purchase covers one business, including its team. Do not resell or redistribute the files, or provide them to clients as their own.