


PMO Portfolio Dashboard
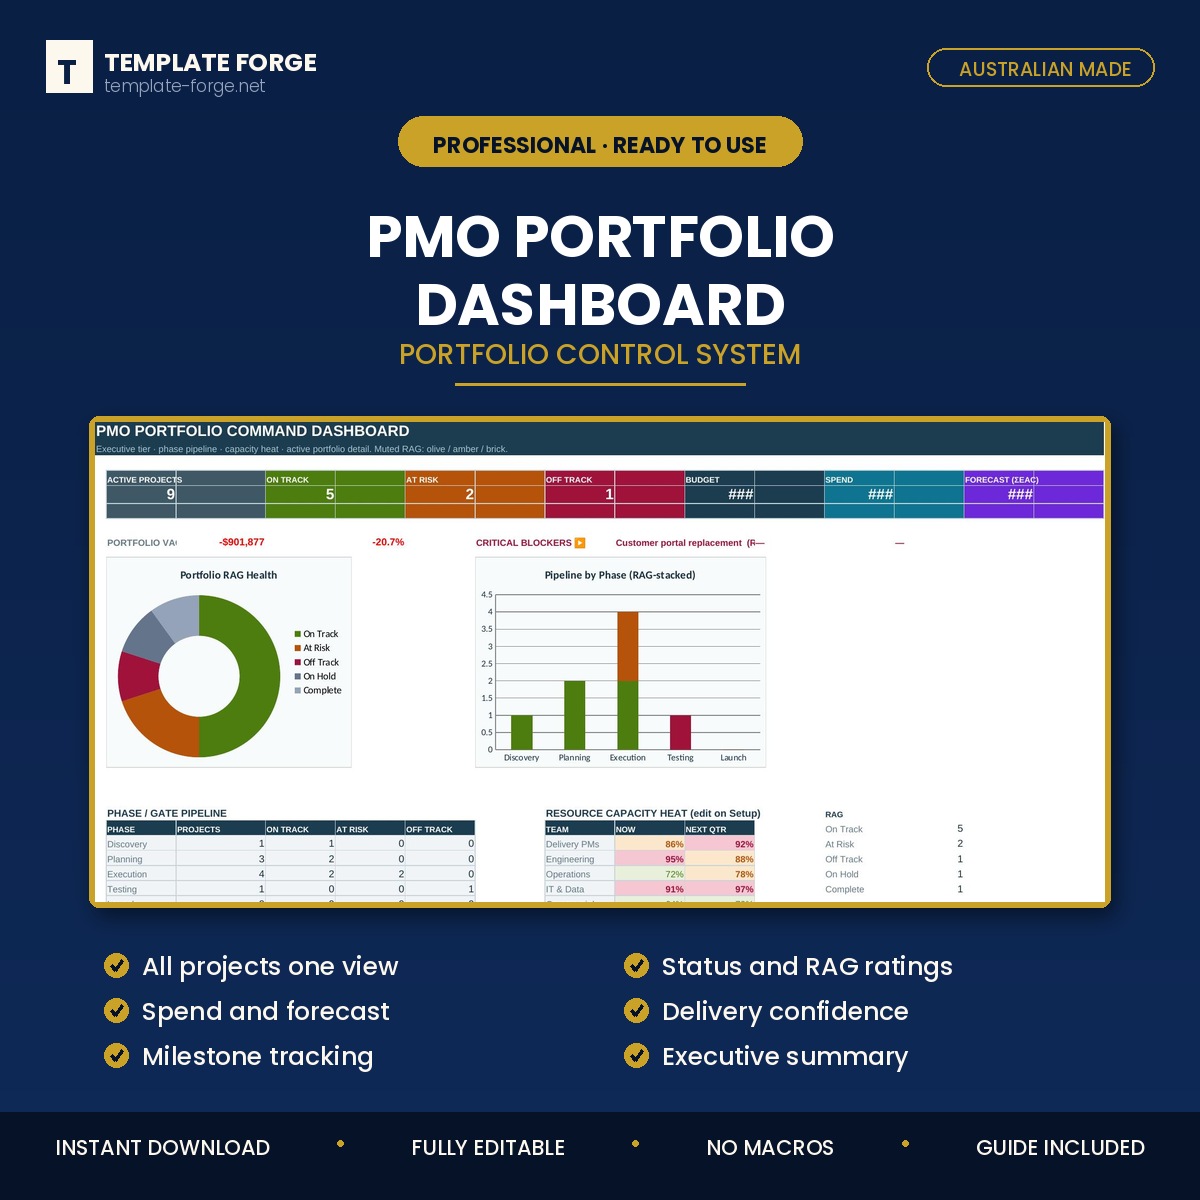
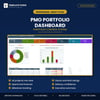
PMO Portfolio Command Dashboard
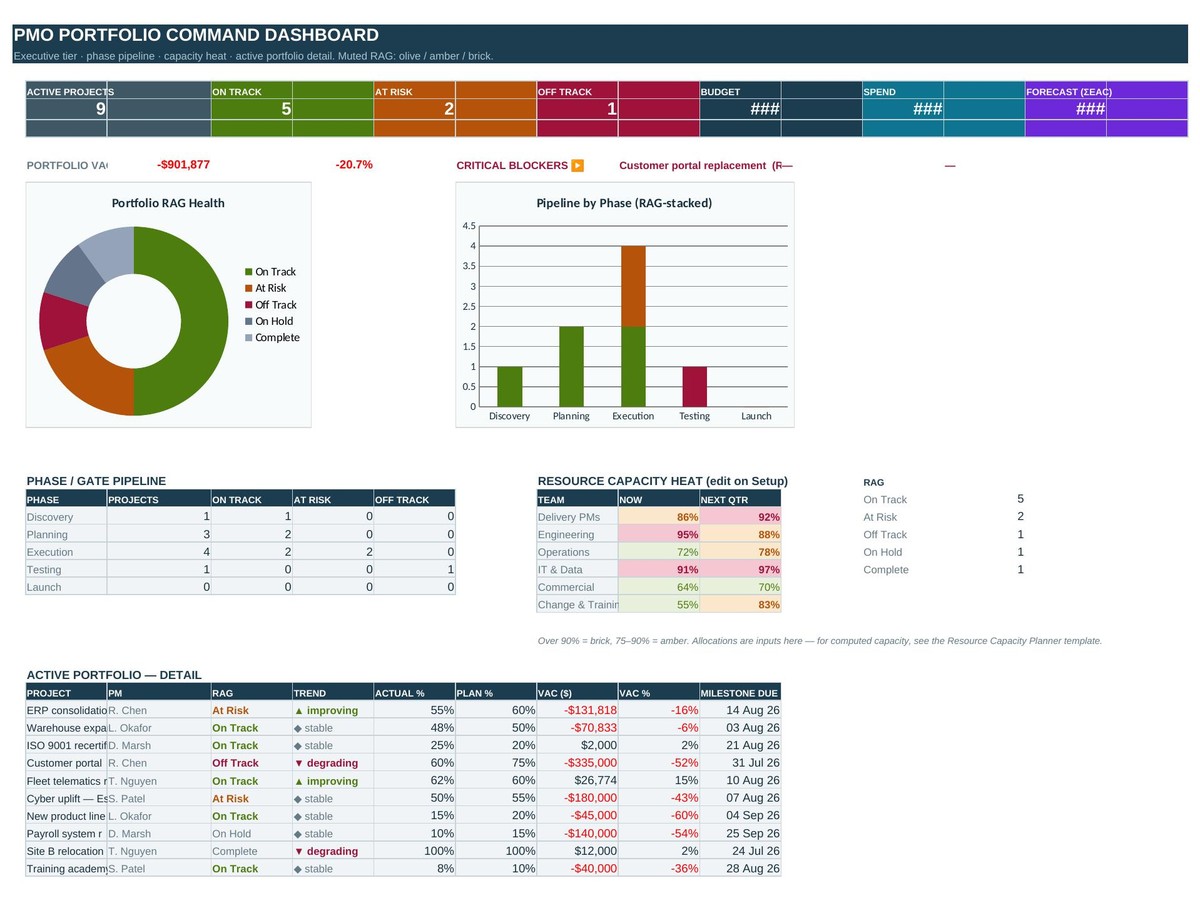
The PMO view of every project — with trend, burn rate and capacity, not just today's status.
A status colour tells you where a project is. It doesn't tell you whether it is getting better or worse. This dashboard carries last period's rating alongside this one, so every project shows a direction as well as a state — and pairs that with burn rate, gate position and team capacity, which is what a PMO actually needs to intervene early.
What's inside
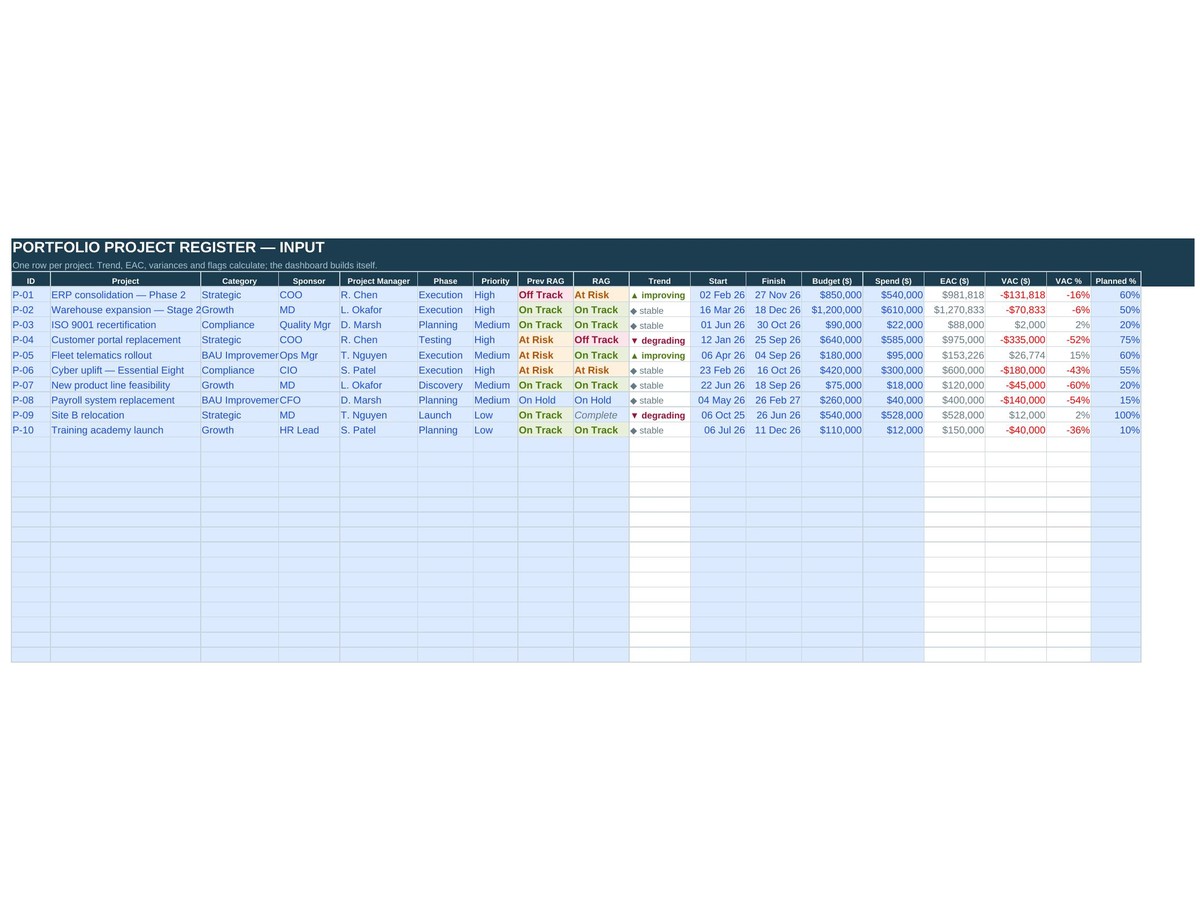
- Portfolio register — every project with phase, owner, budget and status
- RAG with trend — this period against last, so improving and deteriorating projects stand apart
- Burn rate — spend against progress, with estimate at completion and variance calculated
- Phase and gate pipeline — how many projects sit at each gate, and what is stuck
- Capacity heatmap — where the team is overcommitted across the portfolio
- Blockers — what is holding delivery up, surfaced rather than buried
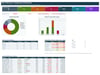
- Executive dashboard — the whole portfolio position on one screen
How it works
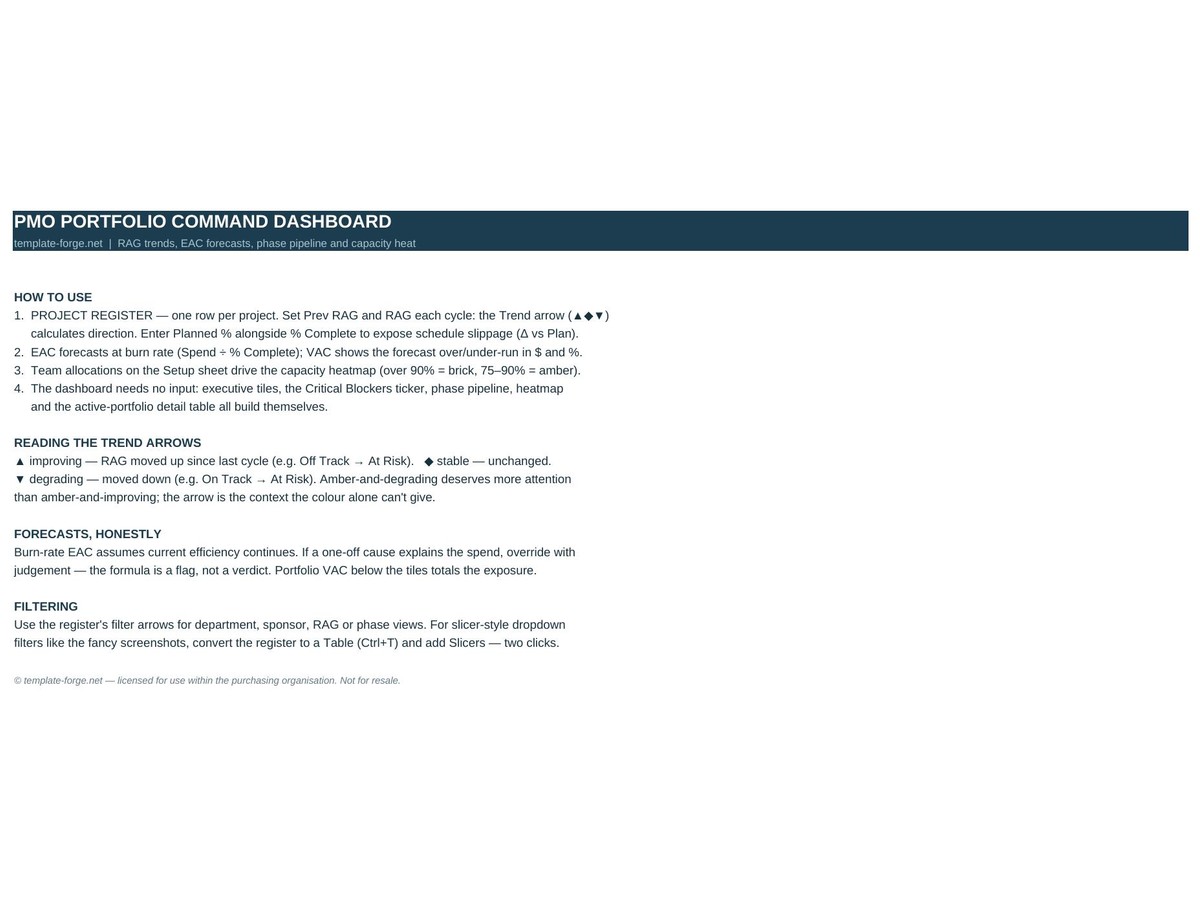
Keep the register current and record each period's rating. Trends, burn rates and the heatmap calculate themselves. No macros, no add-ins, no subscription — a normal Excel file that opens on any version of Excel and keeps working forever.
Built in Australia from more than twenty years of program delivery experience. Instant download, yours to keep, use it across as many portfolios as you like.