ABA Cooper Book Notes | Chapter 6 Study Guide | Graphic Displays & Visual Analysis
On Sale
$8.50
$8.50
📚 31 Pages | 1 Downloadable PDF
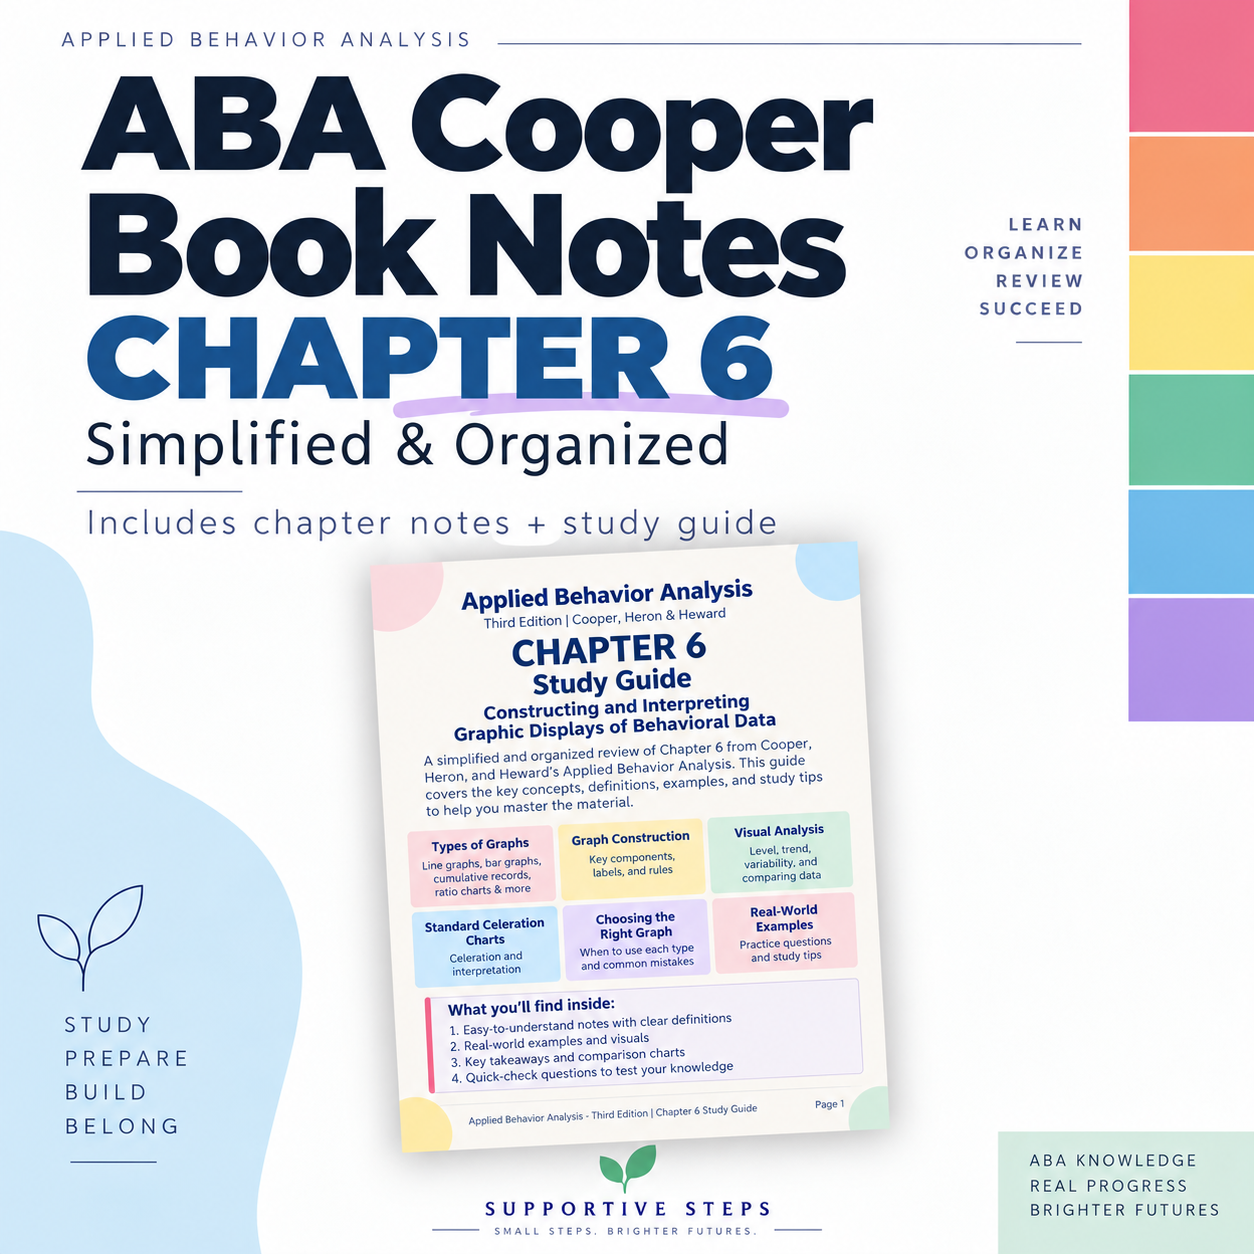
Make Chapter 6: Constructing and Interpreting Graphic Displays of Behavioral Data easier to understand with this simplified and organized ABA study guide.
This 31-page study guide breaks down the major Chapter 6 concepts from Applied Behavior Analysis, Third Edition by Cooper, Heron & Heward into clear definitions, comparisons, examples, visuals, memory cues, and review questions.
✨ Topics include:
- Why graphs are important in ABA
- Line graphs
- Parts of a line graph
- X-axis vs. Y-axis
- Condition change lines
- Condition labels
- Data points & data paths
- Multiple data paths
- Bar graphs
- Cumulative records
- Overall vs. local response rate
- Ratio charts
- Equal-interval vs. ratio scales
- Standard Celeration Charts
- Celeration
- Scatterplots
- Choosing the correct graph
- Graph construction rules
- When not to connect data points
- Figure captions
- Visual analysis
- Level
- Trend
- Variability
- Lines of progress
- Split-middle line of progress
- Comparing data across conditions
- Immediacy of behavior change
- Data overlap
- Common graph interpretation mistakes
- High-yield comparison sheet
- Quick-check questions + answer key
Perfect for ABA students, BCBA/BCaBA students, RBTs, and anyone studying Cooper who wants graphing and visual analysis concepts explained in a more manageable way.
🌱 31 pages of simplified, organized Chapter 6 study material — all in one PDF.