


Deal Tracker Dashboard©
On Sale
$25.00
$25.00
Deal Tracker Dashboard – Visual Trade Performance Analyzer
Track your trades. Understand your results. Improve your trading.
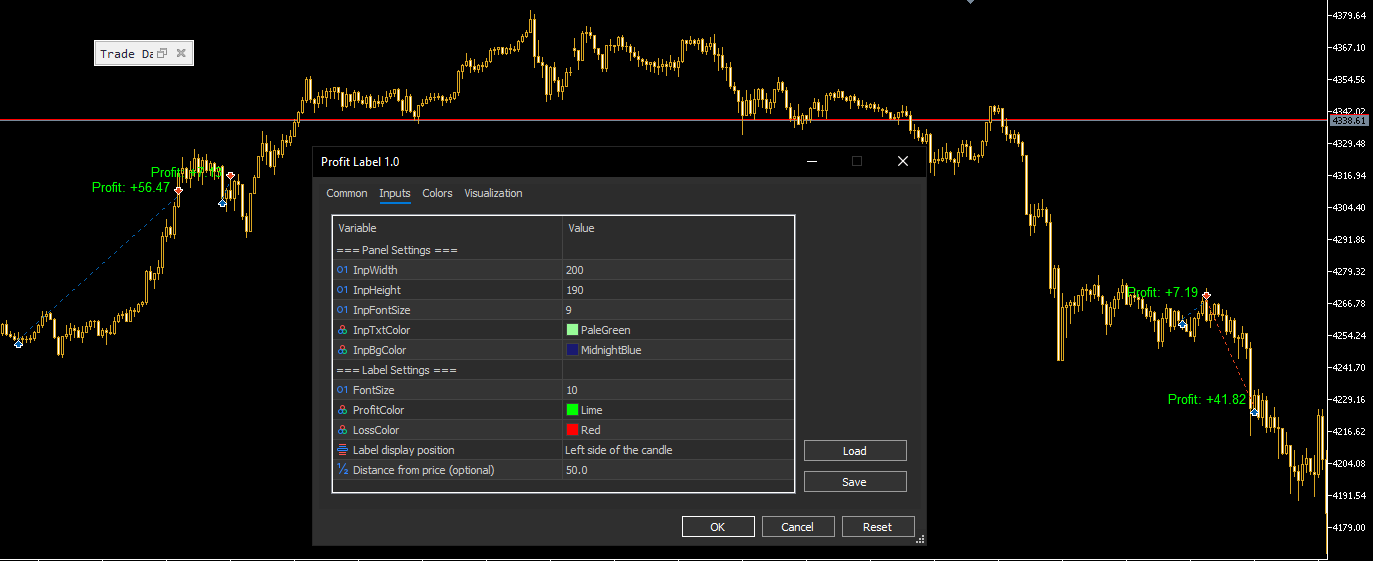
Deal Tracker Dashboard is a professional indicator that transforms your trading history into a smart on-chart dashboard, giving you instant and clear insight into your real trading performance—without opening complex reports.
Each closed trade is displayed directly on the chart at its exact price level, while a clean and elegant statistics panel helps you analyze your results and make better trading decisions with confidence.
Why Deal Tracker Dashboard?
Successful traders don’t just open trades…
They know when, where, and why they win or lose.
This indicator gives you:
- Immediate visual feedback on every closed trade
- Practical performance analysis directly on the chart
- Full control with zero complexity
Key Features
- Professional and interactive on-chart dashboard
- Displays profit or loss for each closed trade directly on price
- Automatic updates from account history
- Smart color coding:
- Green for winning trades
- Red for losing trades
- Fully customizable text position:
- Above price
- Below price
- Right of candle
- Left of candle
- Flexible settings to fit any trading style
- Lightweight, fast, and non-repainting
Displayed Statistics
- Total number of trades
- Winning trades
- Losing trades
- Total profit
- Best trade
- Worst trade
Inputs
- Font size
- Profit color
- Loss color
- Text position
- Distance from price (offset)
💰 One-Time Payment
🔁 Lifetime License
🚫 No Monthly Fees
🔄 Free Updates Included
You Might Also Like
On Sale
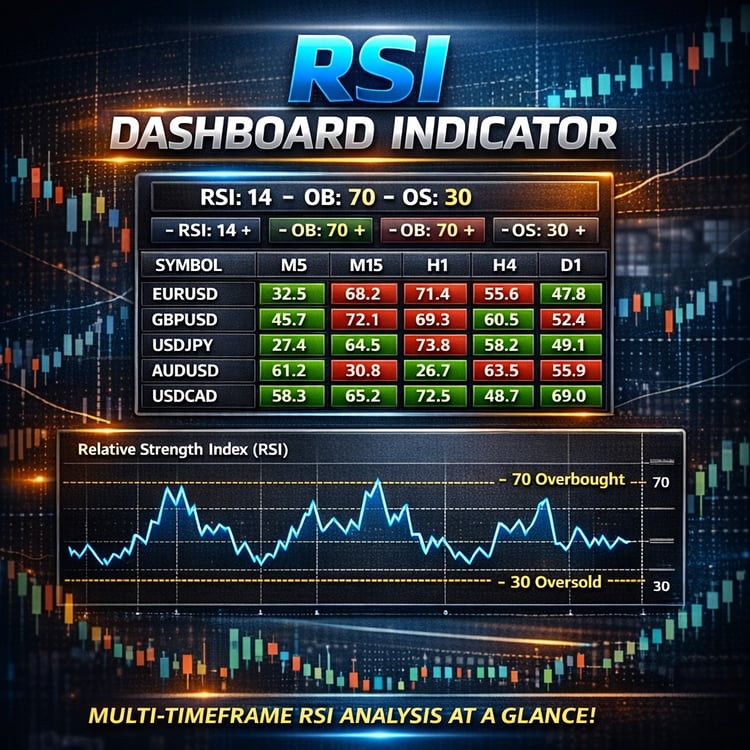
RSI Dashboard Pro©
$48.76
$53.00
$48.76
On Sale


On Sale
Gold Strike EA©
From $100.00
$999.99
On Sale

On Sale
GOLDEN ALGO MT5©
From $115.00
$999.99
On Sale
On Sale
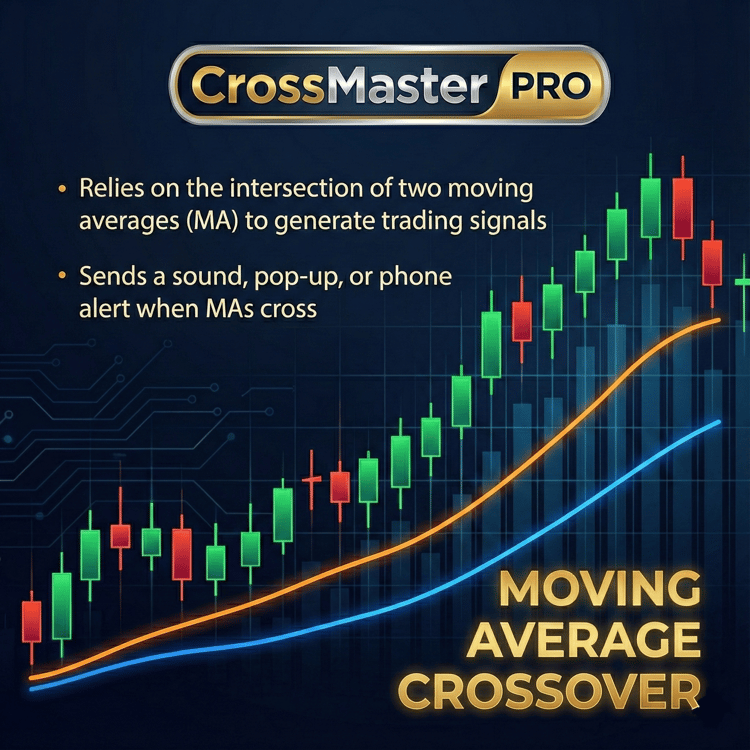
CrossMaster PRO©
$49.68
$54.00
$49.68
On Sale
On Sale
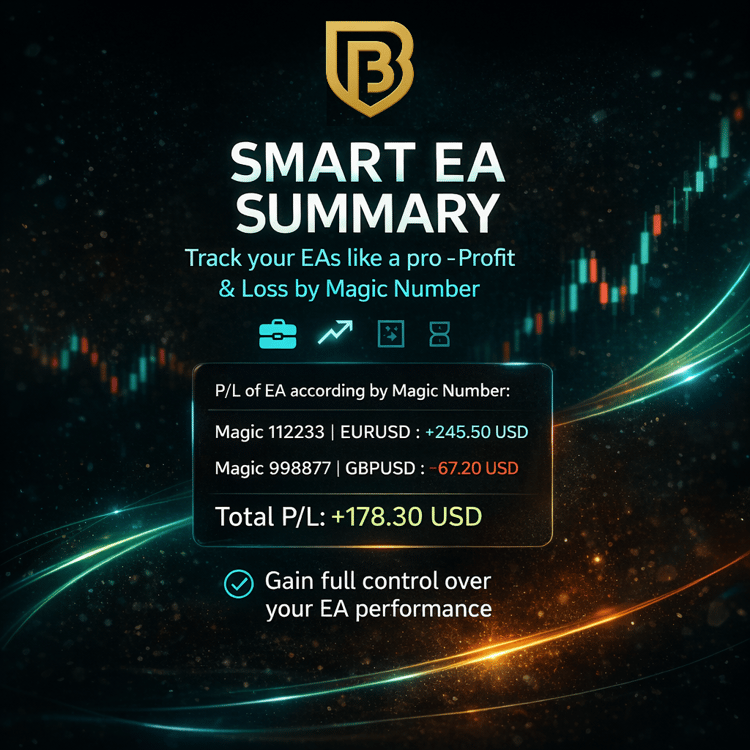
Smart EA Summary MT5©
$45.08
$49.00
$45.08
On Sale
On Sale
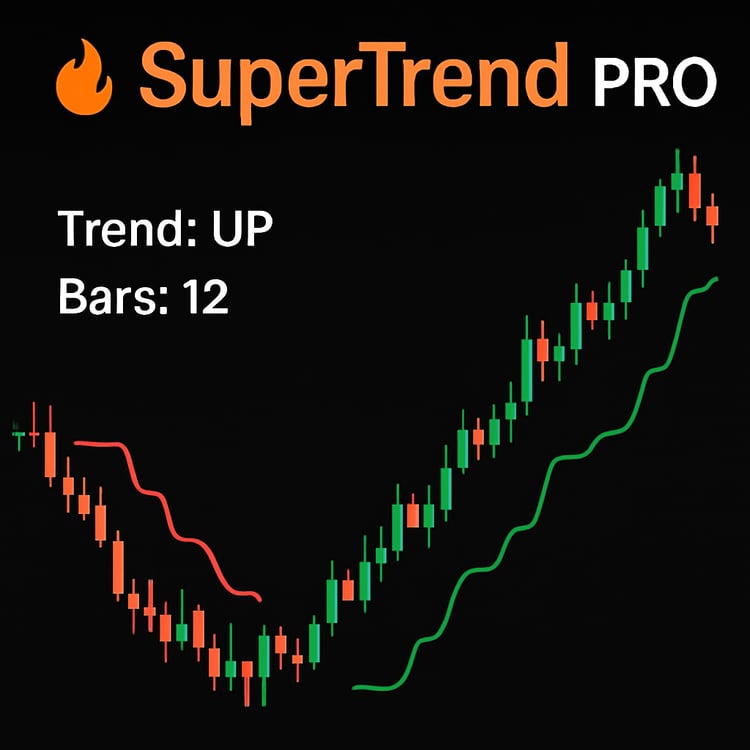
Trend Vision MT5©
$48.76
$53.00
$48.76
On Sale

On Sale
FOREX Strike EA©
From $59.80
$999.99
On Sale

On Sale
GOLDEN Guard Pro EA©
From $62.00
$999.99
On Sale