


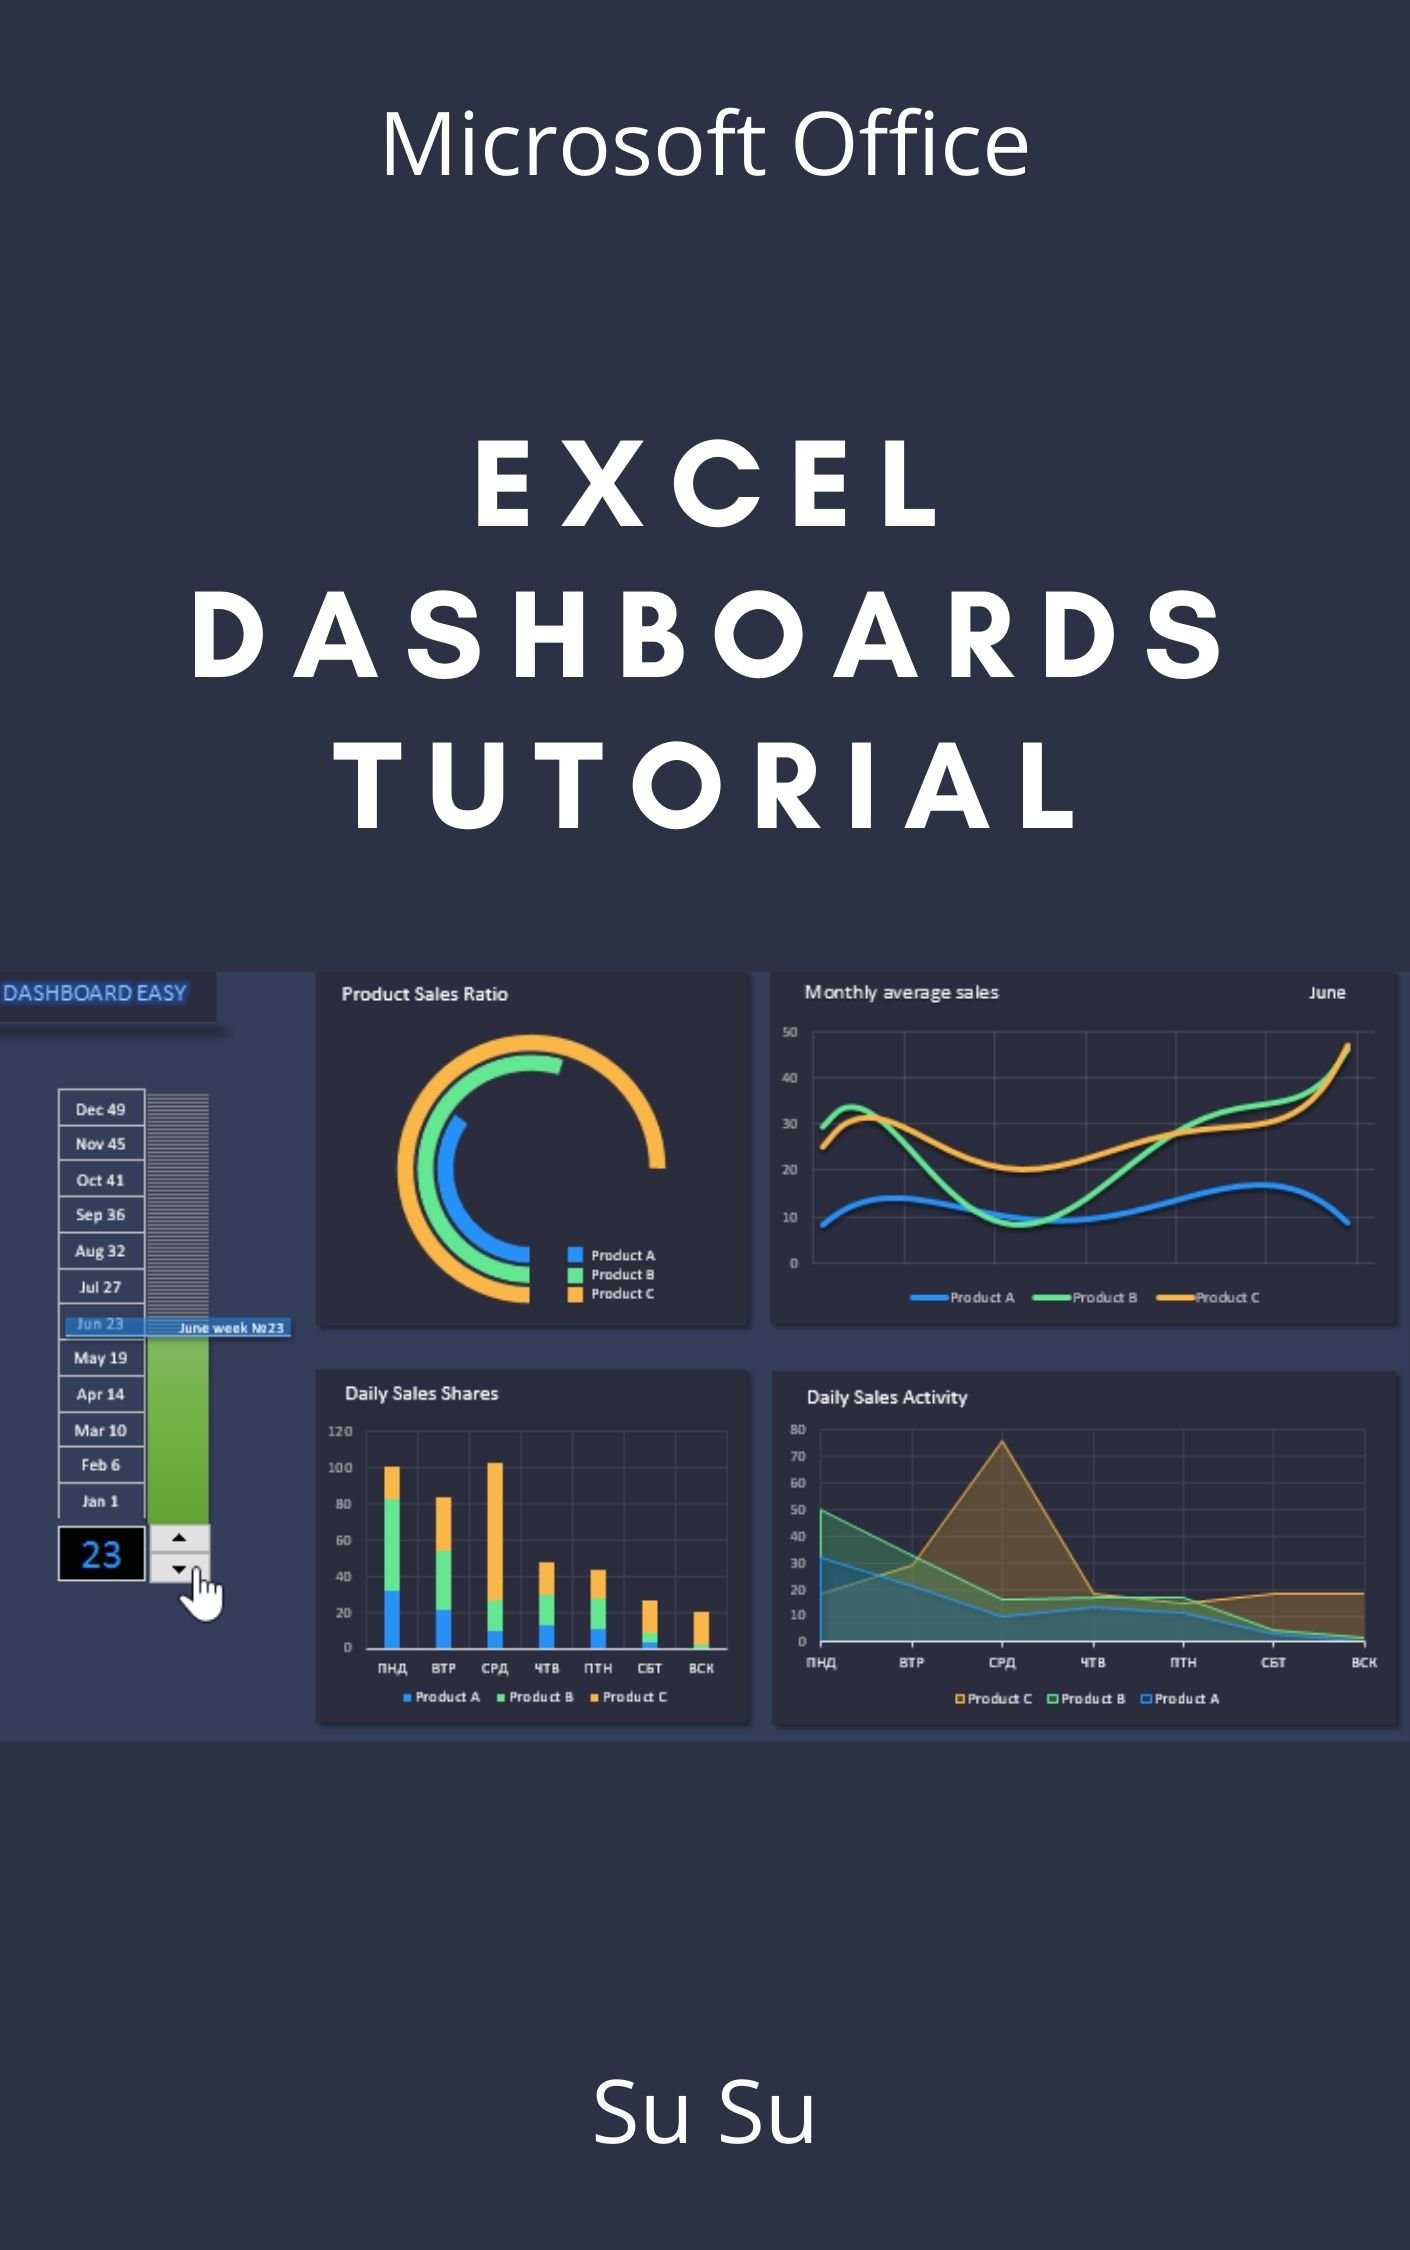
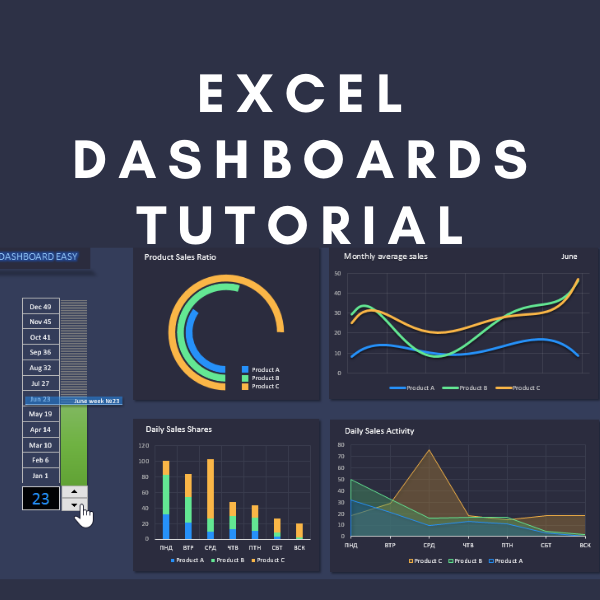
Excel Dashboards Tutorial
On Sale
$0.90
$0.90
Excel Dashboards Tutorial
Dashboards are popular visual displays of data, mostly comprising of charts / graphs with striking attention seeking components. There are various tools available in the market to create dashboards. If you are a Microsoft Office user with reasonably good mastery on Excel, then creating dashboards in Excel is a wise decision. This is because Microsoft has introduced several powerful features in Excel, making your job of handling large datasets from various data sources simple and less tiresome. In this tutorial, you will learn how to use Excel features effectively in dashboards. They include features that can make a dashboard dynamic and interactive.
This tutorial has been designed for all those readers who depend heavily on MS-Excel to prepare charts, tables, and professional reports that involve complex data. It will help all those readers who use MS-Excel regularly to analyze data.
Once you get an understanding of the several Excel features that come handy in creating Excel dashboards, creating dashboards will become a trivial task for you.
Before proceeding with this tutorial, the reader should have a preliminary understanding of Excel workbooks, Excel charts, Excel PivotTables, Excel Data Model, Excel Power PivotTables and Power PivotCharts and Excel Power View reports. All these topics are available as full-fledged tutorials in our tutorials library.
Table of Contents
Excel Dashboards - IntroductionExcel Features to Create Dashboards
Excel Dashboards - Conditional Formatting
Excel Dashboards - Excel Charts
Excel Dashboards - Interactive Controls
Excel Dashboards - Advanced Excel Charts
Excel Dashboards - PivotTables
Power PivotTables & Power PivotCharts
Excel Dashboards - Power View Reports
Key Performance Indicators
Excel Dashboards - Build a Dashboard
Excel Dashboards - Examples