




The Gann Box Explained — Measured (PDF Guide)
Gann tools are taught with more certainty than anything else on a chart, and the centrepiece is the one-by-one line said to run at forty-five degrees. Nobody who teaches it mentions that forty-five degrees is only forty-five degrees on one particular shape of window, and that dragging the corner of your chart changes it.
This guide draws one box -- 100 price units by 50 bars -- on three common chart shapes and reports the angle each time. The box never changes. The answer does, by 15.6 degrees, and the arithmetic showing why takes four lines. This is a 46-page PDF that teaches The Gann Box from the first thing you see on the screen through to a written strategy with an entry, a stop and an explicit rule for when the trade is wrong.
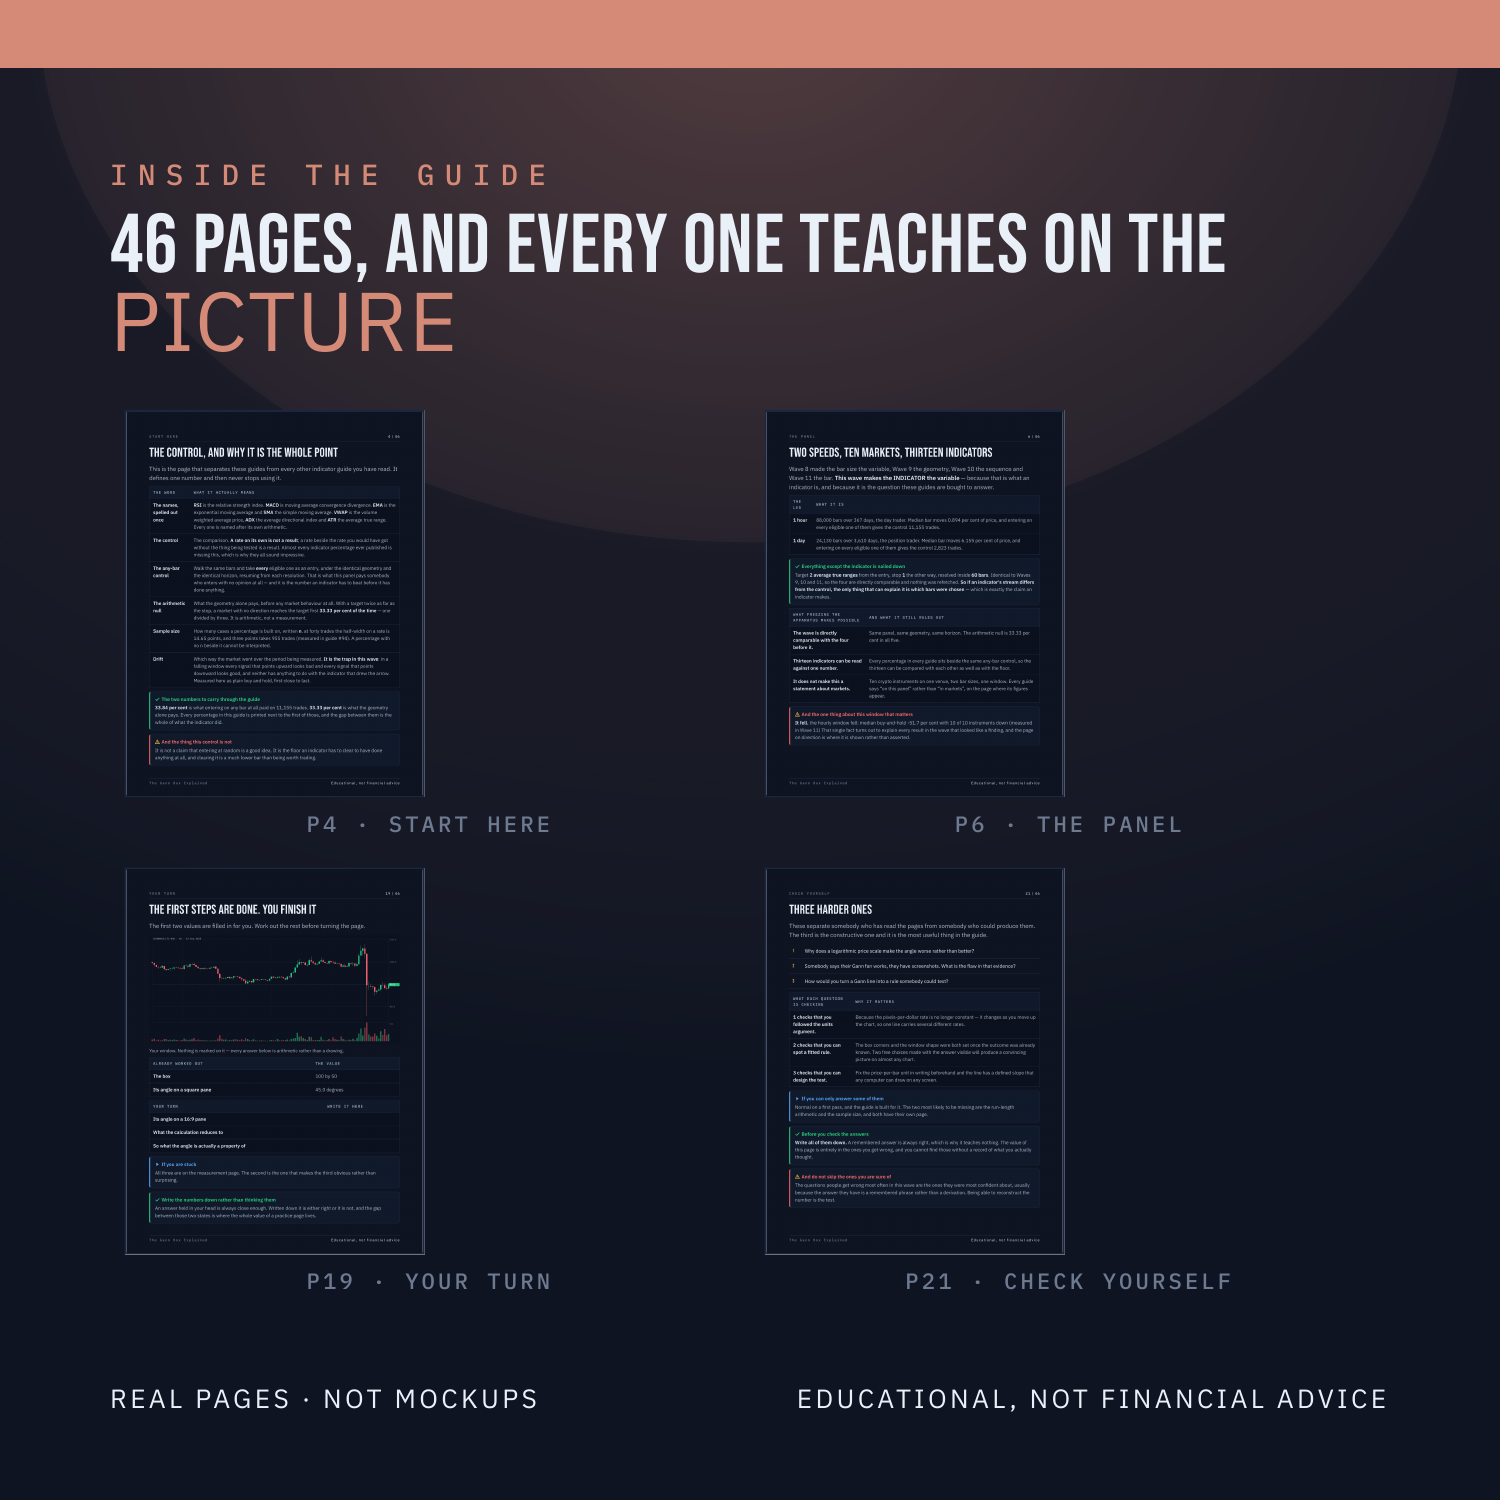
Nothing is taught underneath a chart. Every label sits on the candle, the line or the level it is describing, on real BTC, ETH, SOL and LINK charts. There are three quizzes on real charts, each followed by the same chart re-shown annotated with the reasoning, plus faded practice pages where the first steps are filled in and you finish the rest.
WHAT'S INSIDE
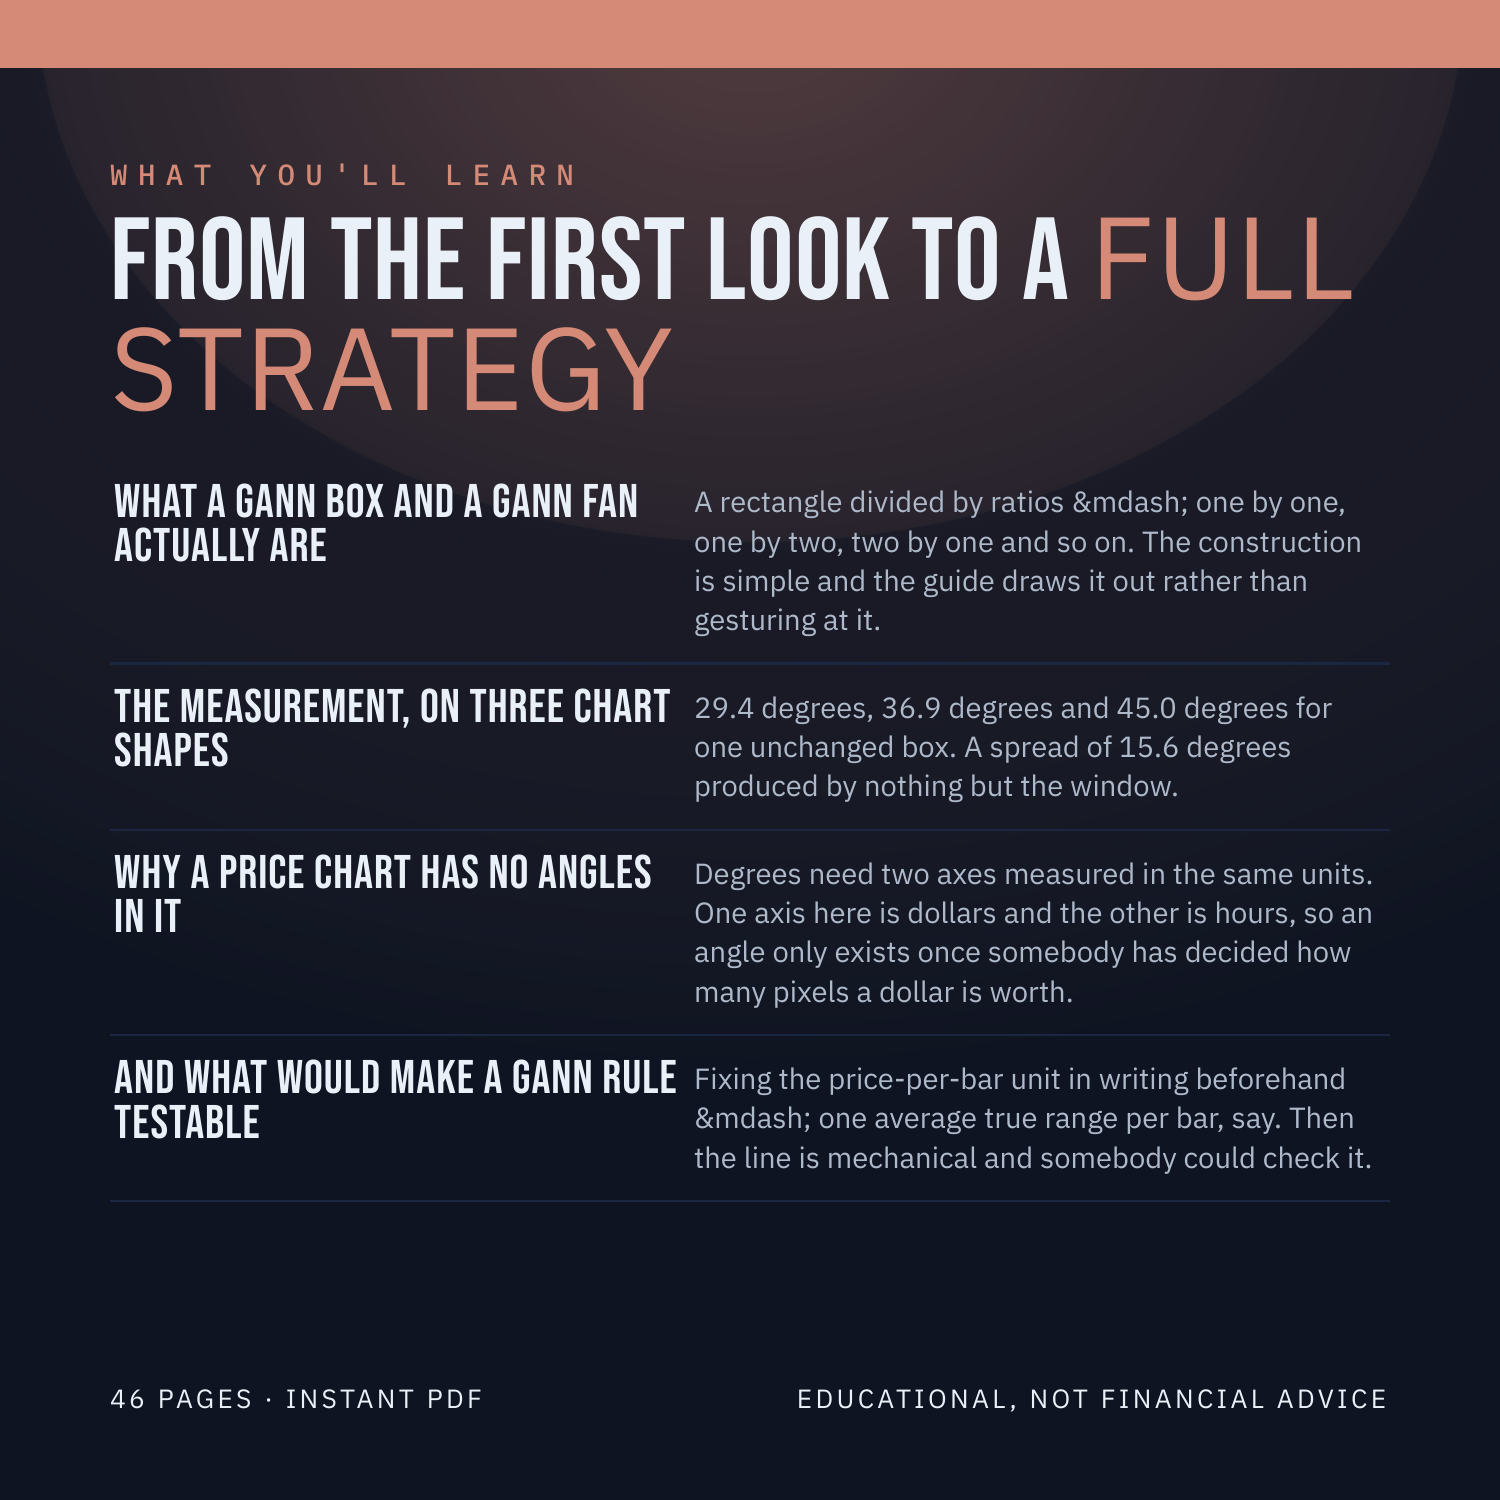
What a Gann box and a Gann fan actually are -- A rectangle divided by ratios -- one by one, one by two, two by one and so on. The construction is simple and the guide draws it out rather than gesturing at it.
The measurement, on three chart shapes -- 29.4 degrees, 36.9 degrees and 45.0 degrees for one unchanged box. A spread of 15.6 degrees produced by nothing but the window.
Why a price chart has no angles in it -- Degrees need two axes measured in the same units. One axis here is dollars and the other is hours, so an angle only exists once somebody has decided how many pixels a dollar is worth.
And what would make a Gann rule testable -- Fixing the price-per-bar unit in writing beforehand -- one average true range per bar, say. Then the line is mechanical and somebody could check it.
WHAT YOU'LL BE ABLE TO DO
Draw a Gann box and say what each ratio line means.
Explain why the one-by-one line is not always forty-five degrees.
Predict the angle on any chart shape, with one arctangent.
Say why a price chart has no intrinsic angles at all.
Turn a scale-dependent rule into one somebody could test.
AN HONEST NOTE
The Gann Box is a clue, not a crystal ball. It describes what price has already done. This guide contains no win-rates, no backtest results and no promises about what you will make, because nobody can verify those and you should not trust anyone who prints them. What it hands you instead is a set of rules you can test yourself on TradingView in an afternoon. Educational, not financial advice.
Instant download. 46 pages, PDF.