

Radian - HTML CSS JS Dashboard Widget and Chart Kit
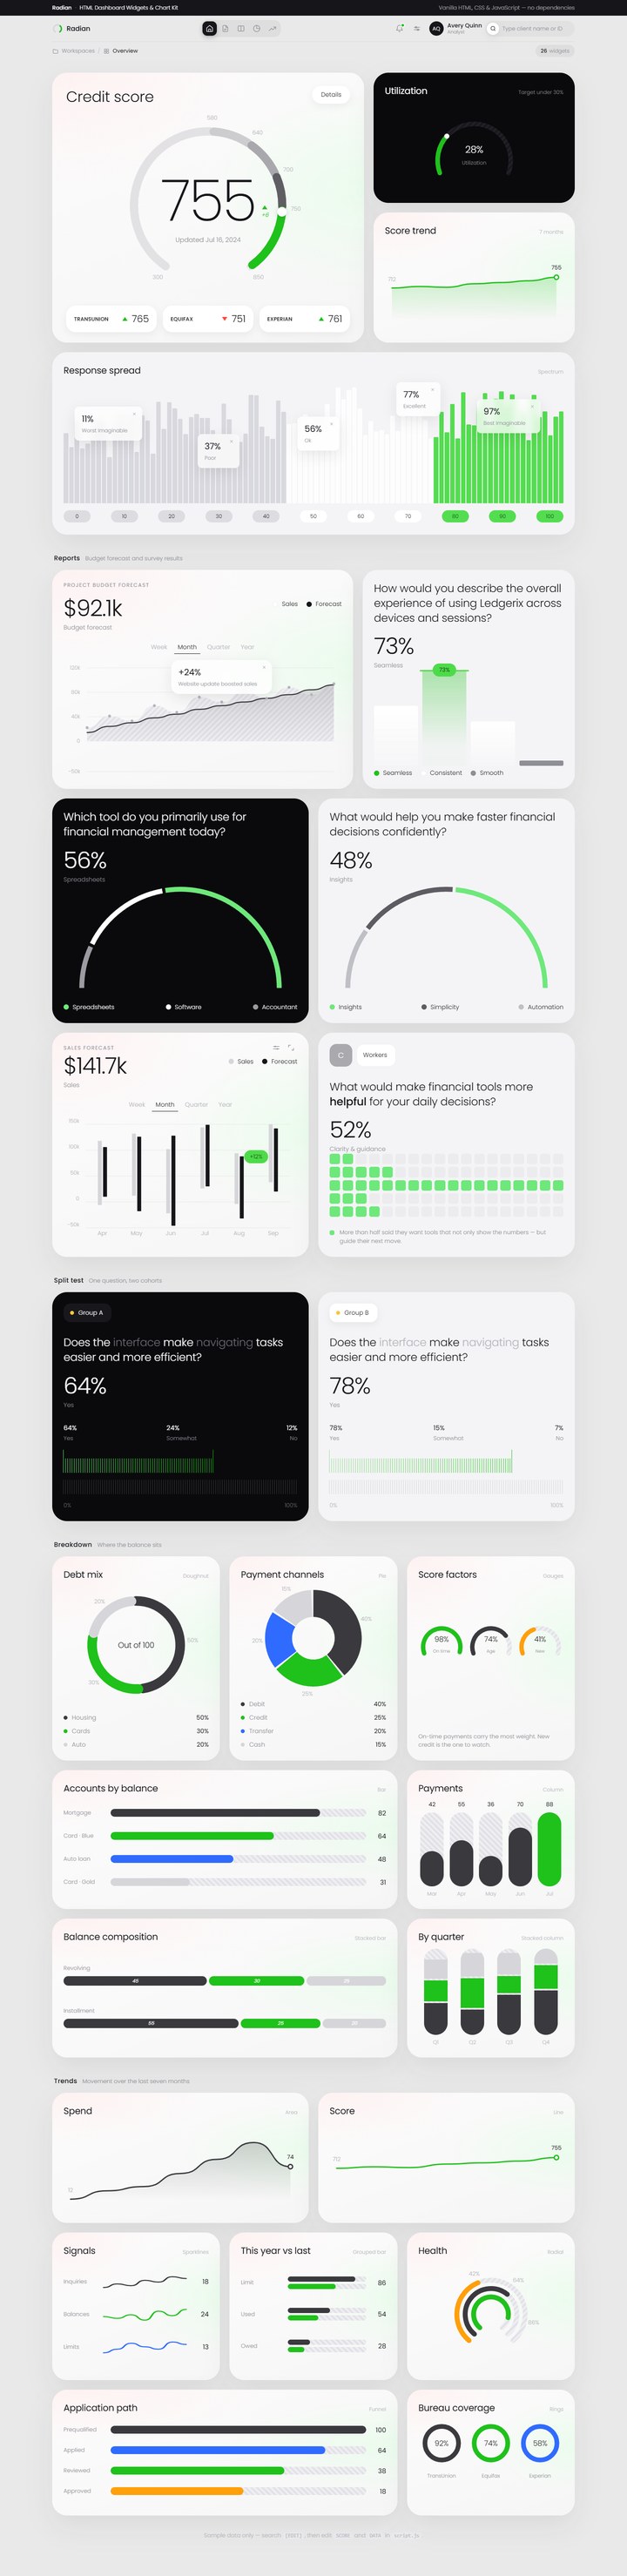
A responsive one-page dashboard kit with 26 SVG and HTML chart stages, editable sample data, animated KPI cards, surveys, forecasts, and comparison views.
Full Description
Radian is a collection of dashboard widgets arranged in one cohesive analytics page. Its 26 chart stages cover scores, distributions, trends, forecasts, surveys, comparisons, and conversion views. The layout includes a sticky two-row header, section navigation, a segmented score gauge, report cards, split-test cards, breakdown charts, and trend visualizations.
Charts are rendered from local JavaScript data using SVG and HTML/CSS, without a third-party chart library. In-view motion counts numbers, draws paths, grows bars, and moves the score marker; visitors who request reduced motion receive static content. The displayed finance theme and all values are samples that can be replaced for other industries, dashboards, client projects, reports, or internal tools.
Key Features
- 26 chart stages across one responsive dashboard page
- Five page sections: Overview, Reports, Split Test, Breakdown, and Trends
- Segmented score gauge with bands, ticks, source values, and moving marker
- Doughnut, pie, single and multiple gauges, bar, column, stacked, grouped, line, area, radial, funnel, rings, and sparklines
- Forecast area chart and floating-range bars with Week, Month, Quarter, and Year controls
- Survey columns, segmented half-circle polls, pictogram matrix, response spectrum, and linear tick-comb meters
- Scroll-triggered chart and number animation
- Sticky header with section links, active breadcrumb, automatic widget count, and scroll frost
- Dismissible chart callouts
- Editable CSS tokens and JavaScript data objects
- Reduced-motion behavior
- No framework, build tool, or chart-library dependency
Included Page and Files
- `index.html` — dashboard structure, header, cards, chart stages, and sample copy
- `assets/css/styles.css` — tokens, surfaces, grid, chart styling, motion, and responsive rules
- `assets/js/script.js` — sample data, SVG/HTML rendering, range controls, navigation state, and animation
- `README.md` — setup, chart reference, customization, and data guidance
- `LICENSE.txt` — controlling license terms
Best For / Use Cases
- Analytics and KPI dashboards
- Financial, operational, or product reports
- Survey and research result presentations
- Score, risk, and assessment interfaces
- Data-visualization prototypes
- Individual chart-card extraction for client or internal projects
- Re-themed dashboards for other industries and datasets
Technical Details
- HTML5, CSS3, vanilla JavaScript, and inline SVG
- 26 `[data-chart]` stages validated in `index.html`
- Responsive card stacking below `1040px`
- Progressive header simplification at `1180px`, `1020px`, `860px`, and `640px`
- Local data objects including `SCORE`, `DATA`, `FORECAST`, `SURVEY`, `POLLS`, `SALES`, `MATRIX`, `COMBS`, and `SPECTRUM`
- Poppins loaded from Google Fonts
- `[EDIT]` markers identify primary customization points
Customization
Edit headings, labels, questions, navigation, and card arrangement in `index.html`. Change surfaces, colors, stripes, radii, spacing, and responsive behavior in `assets/css/styles.css`. Replace scores and chart series in the documented data objects in `assets/js/script.js`; keep JavaScript palette values synchronized with related CSS variables. The finance-flavored demo can be adapted to any industry, dataset, product, report, or project.
Important Notes / Limitations
- All scores, provider names, account details, survey results, forecasts, annotations, and financial values are static sample content.
- Week, Month, Quarter, and Year controls switch between local sample datasets; they do not request remote data.
- Section navigation only scrolls within the page.
- Search, notifications, settings, account controls, Details, Adjust, and Expand are demo-only interface controls without application actions.
- No live feed, database, API, authentication, persistence, export function, or backend is included.
- The kit provides visual chart components; projects requiring dynamic data or nonvisual chart access need an appropriate integration and accessibility review.
Third-Party Assets / Internet Requirements
Poppins loads from Google Fonts and requires an internet connection unless it is replaced or self-hosted. Charts, patterns, icons, and the logo mark are generated with HTML, CSS, inline SVG, and vanilla JavaScript. No image bundle, external icon library, or third-party chart library is required. Third-party resources remain subject to their own terms.
License Summary
The root `LICENSE.txt` governs use and is controlling if this summary differs. In summary, one validly acquired license covers creation of one customized End Product for the licensee or one client, subject to the permissions and restrictions in that file. Redistribution of the kit source or use in a competing downloadable template, chart kit, or source-file collection is restricted.
Publisher
Tech & ALL
https://www.techandall.com
Suggested Search Tags
dashboard widgets, KPI cards, HTML charts, data visualization, chart kit, score gauge, survey charts, forecast chart, analytics dashboard, SVG charts, vanilla JavaScript, animated charts, infographic elements, reporting template, responsive dashboard