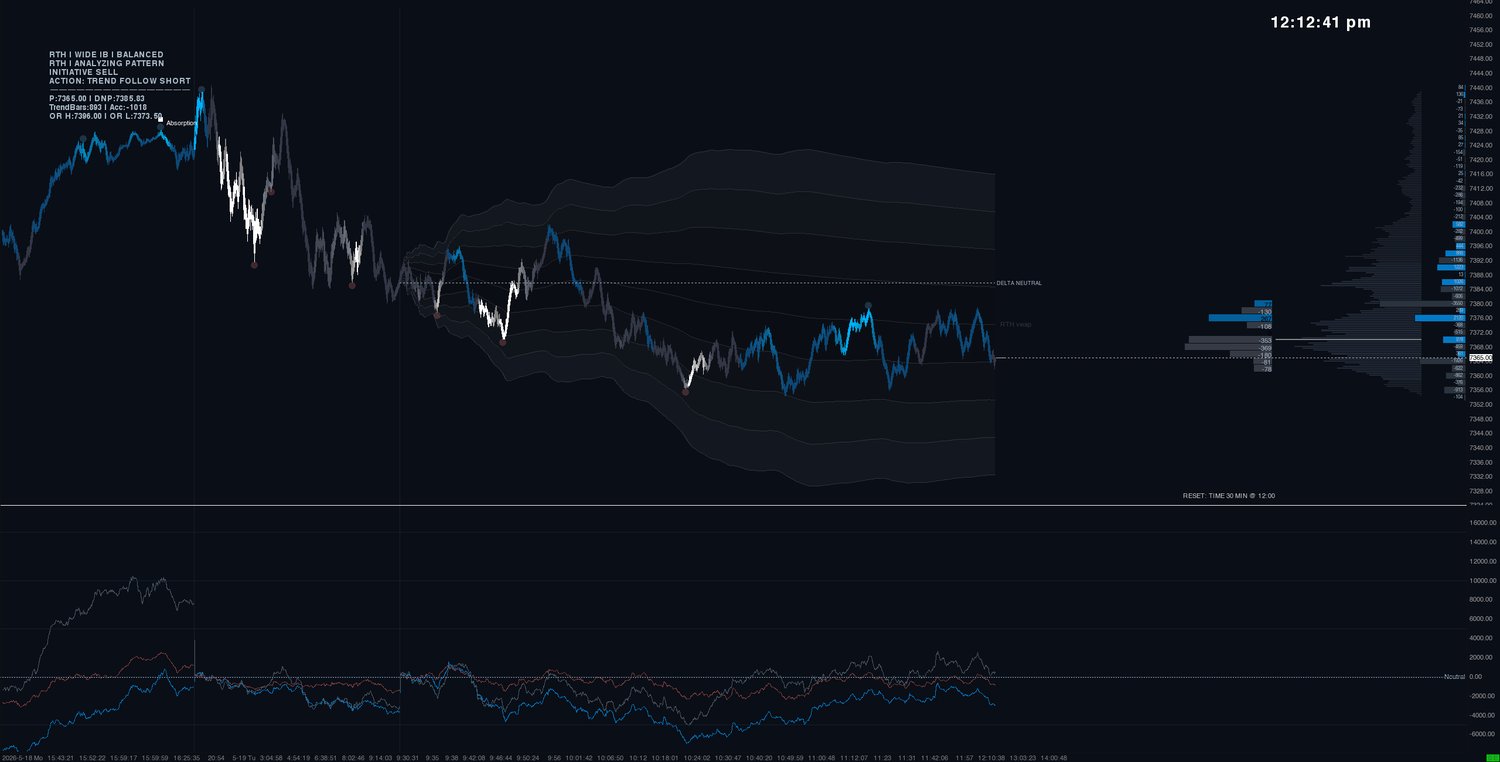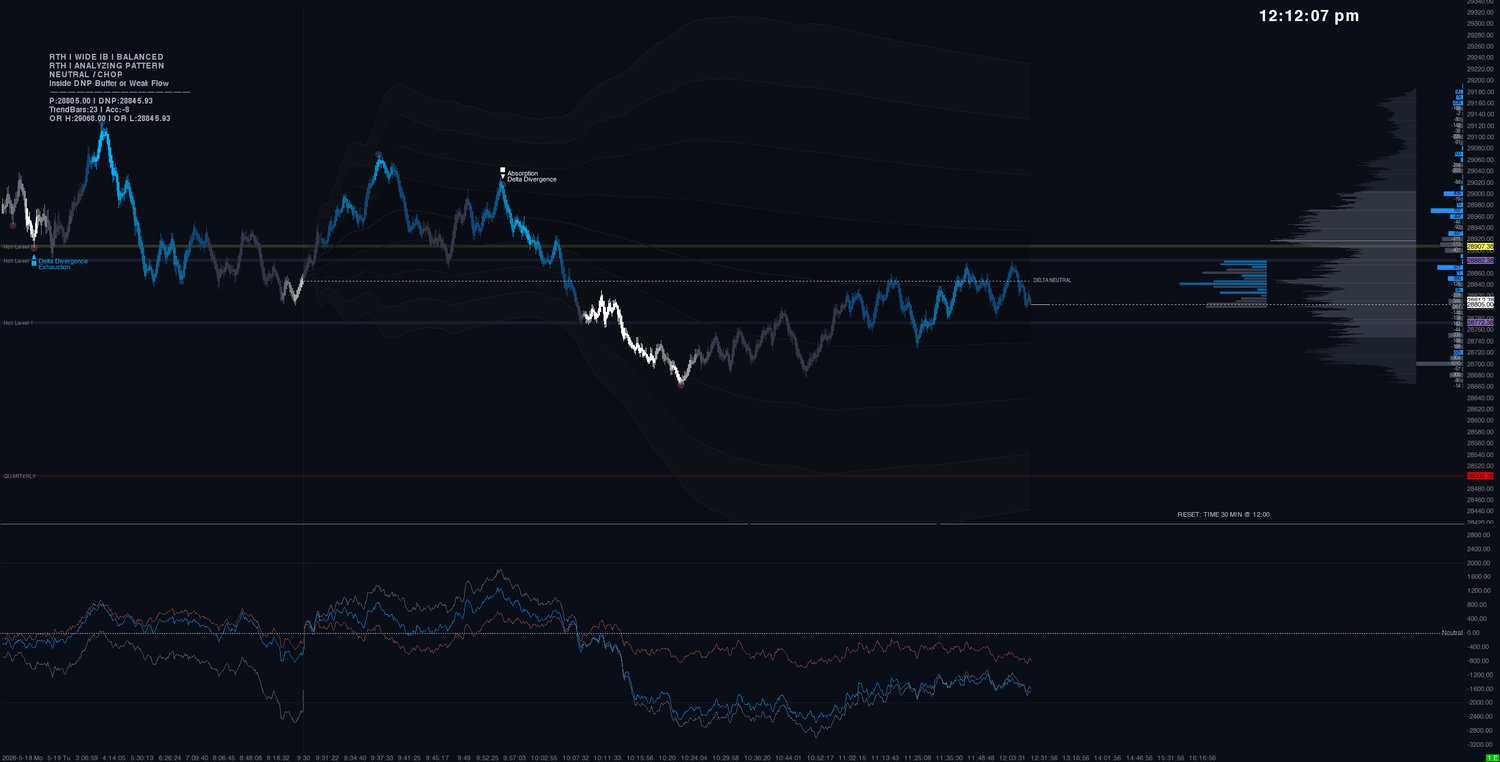
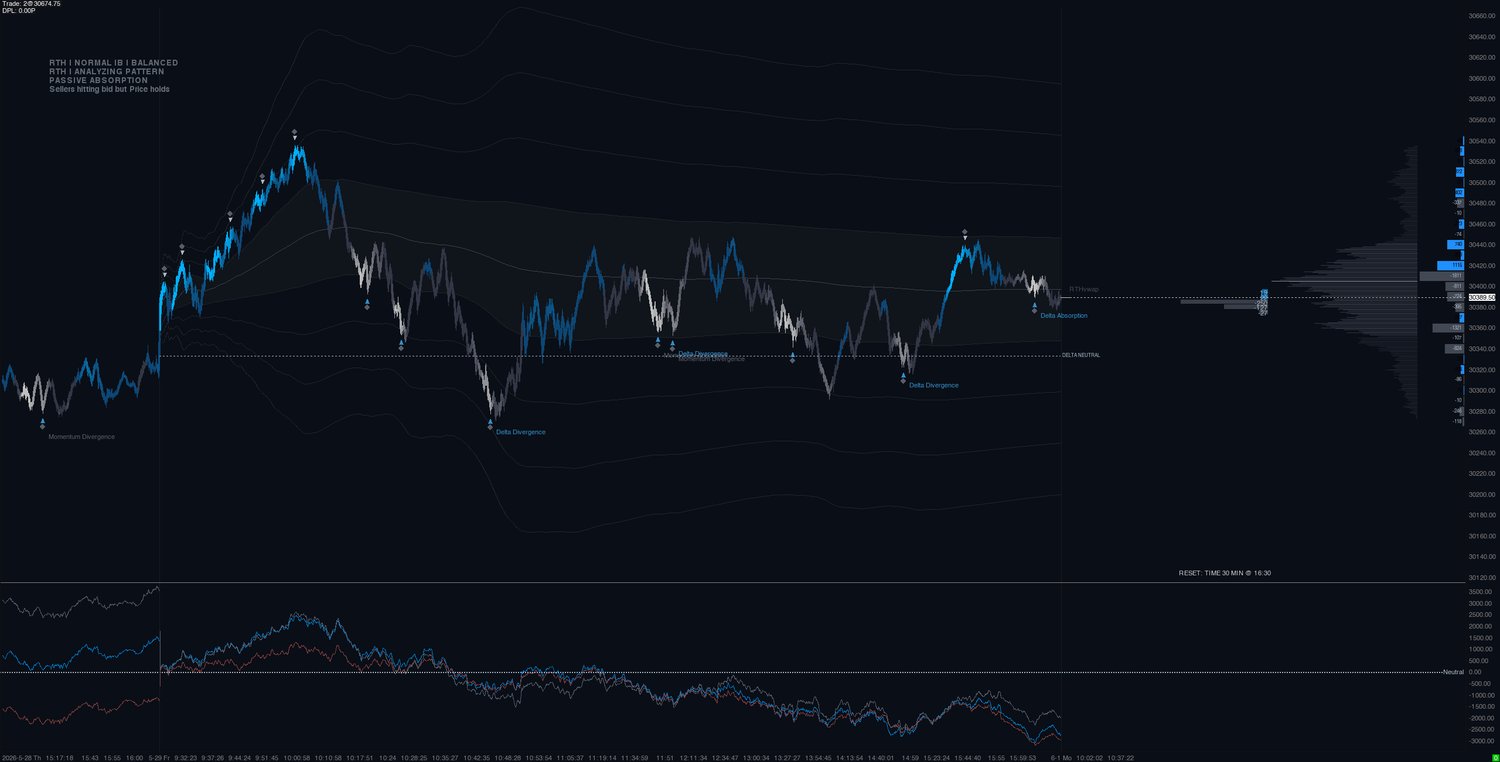
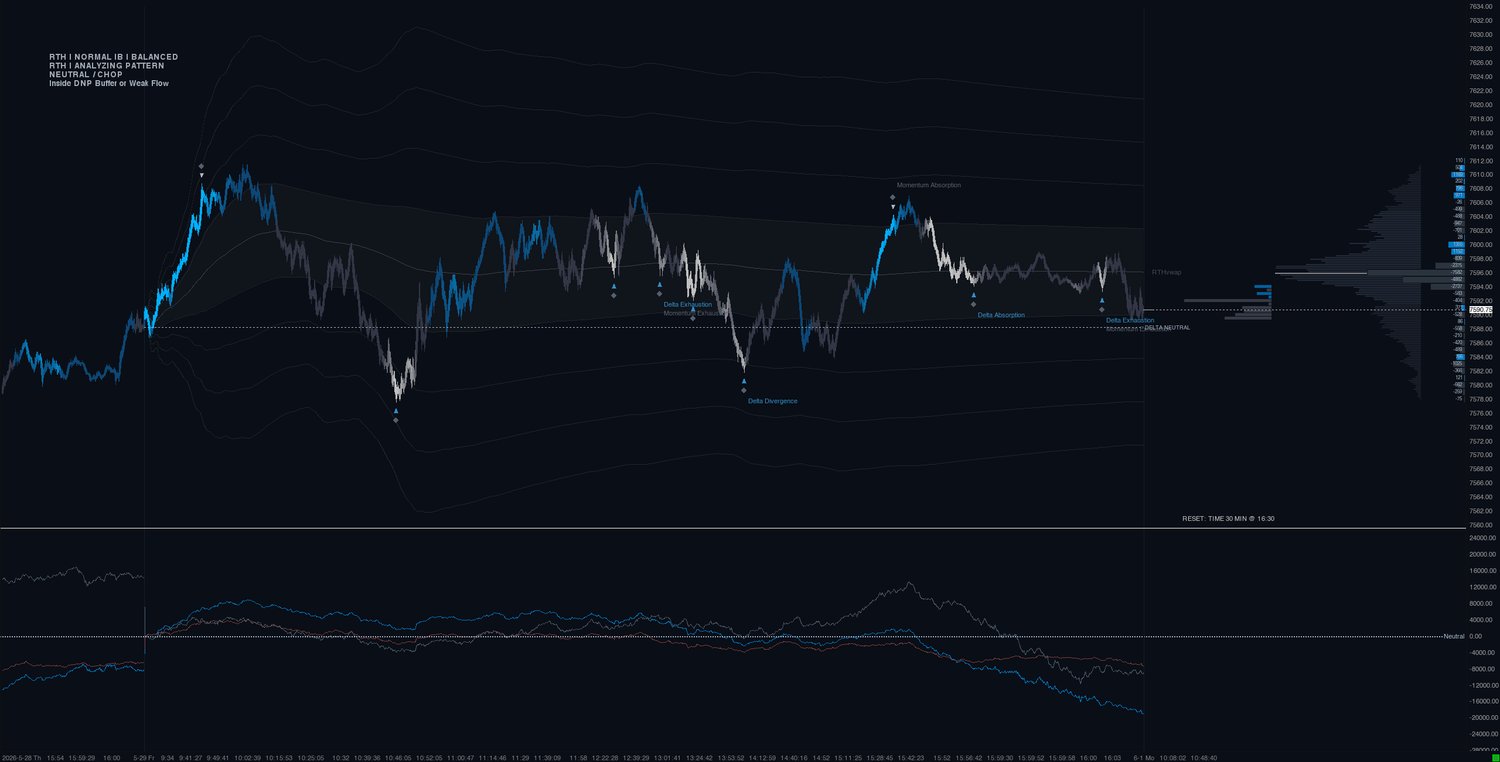
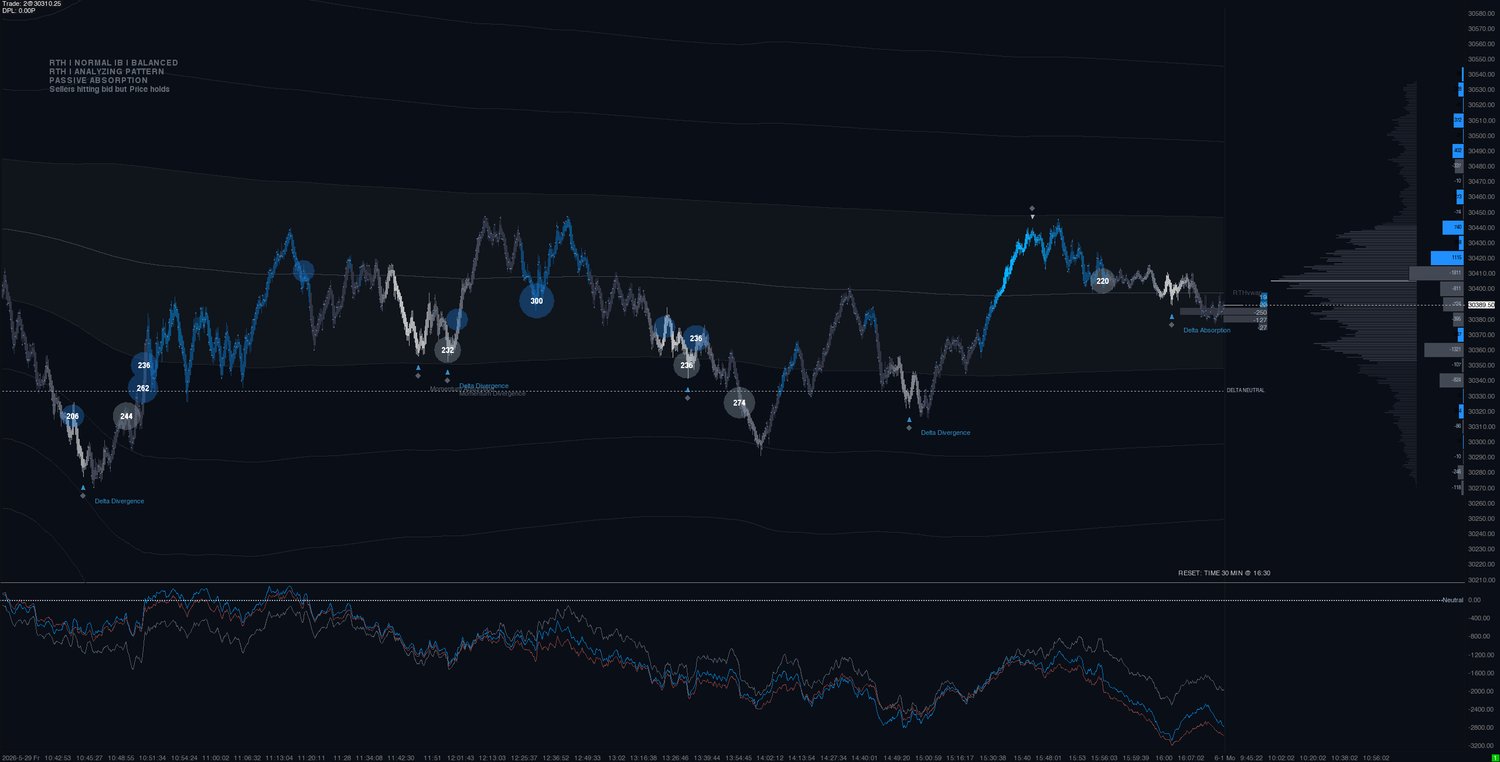
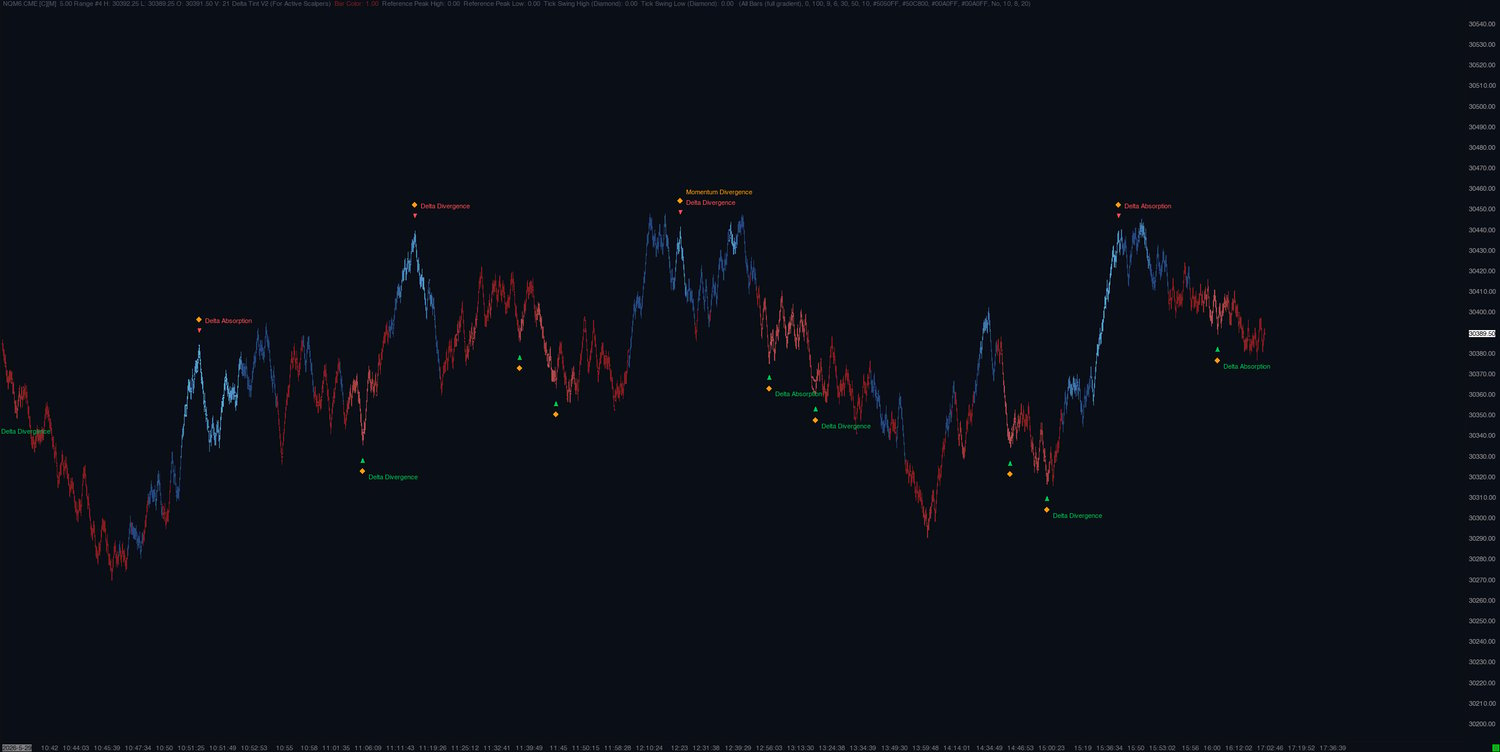
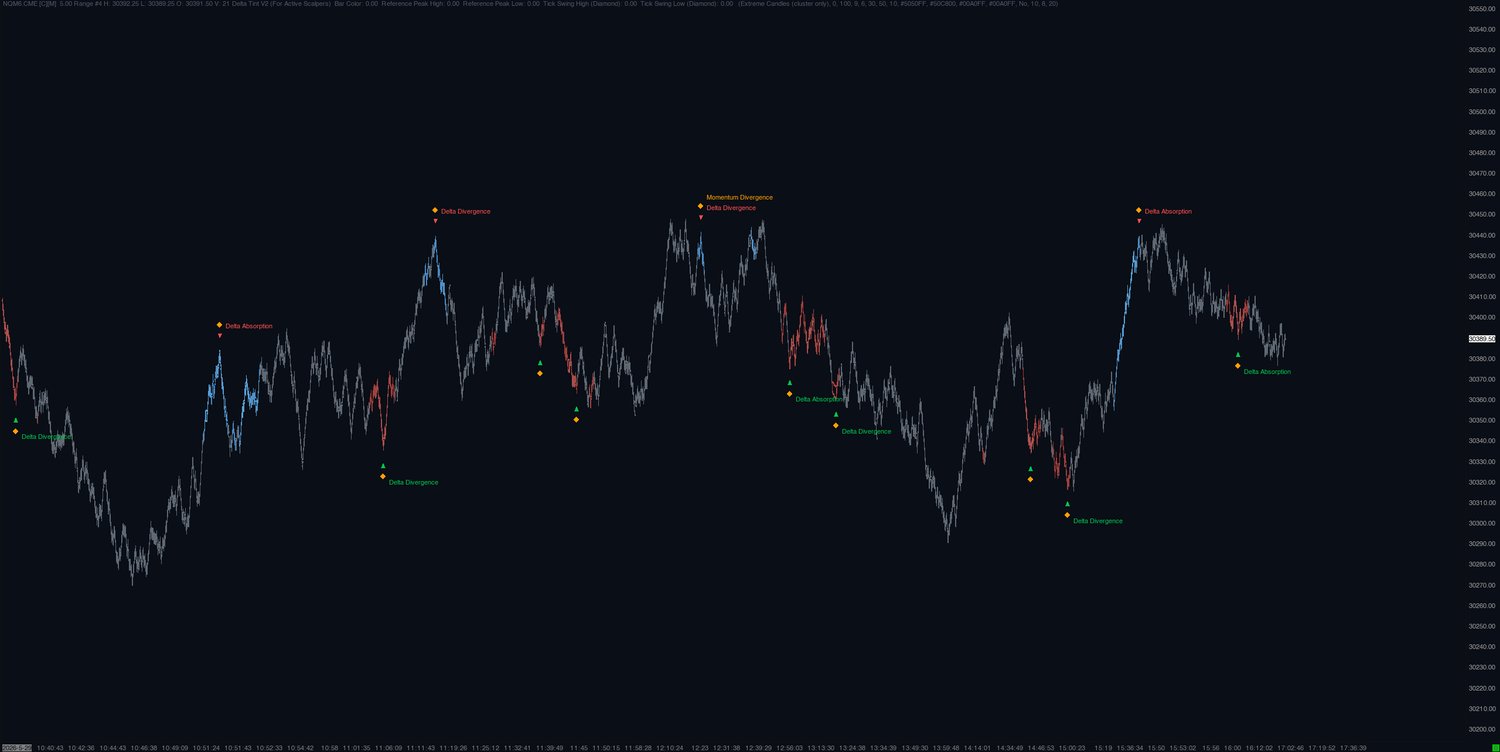
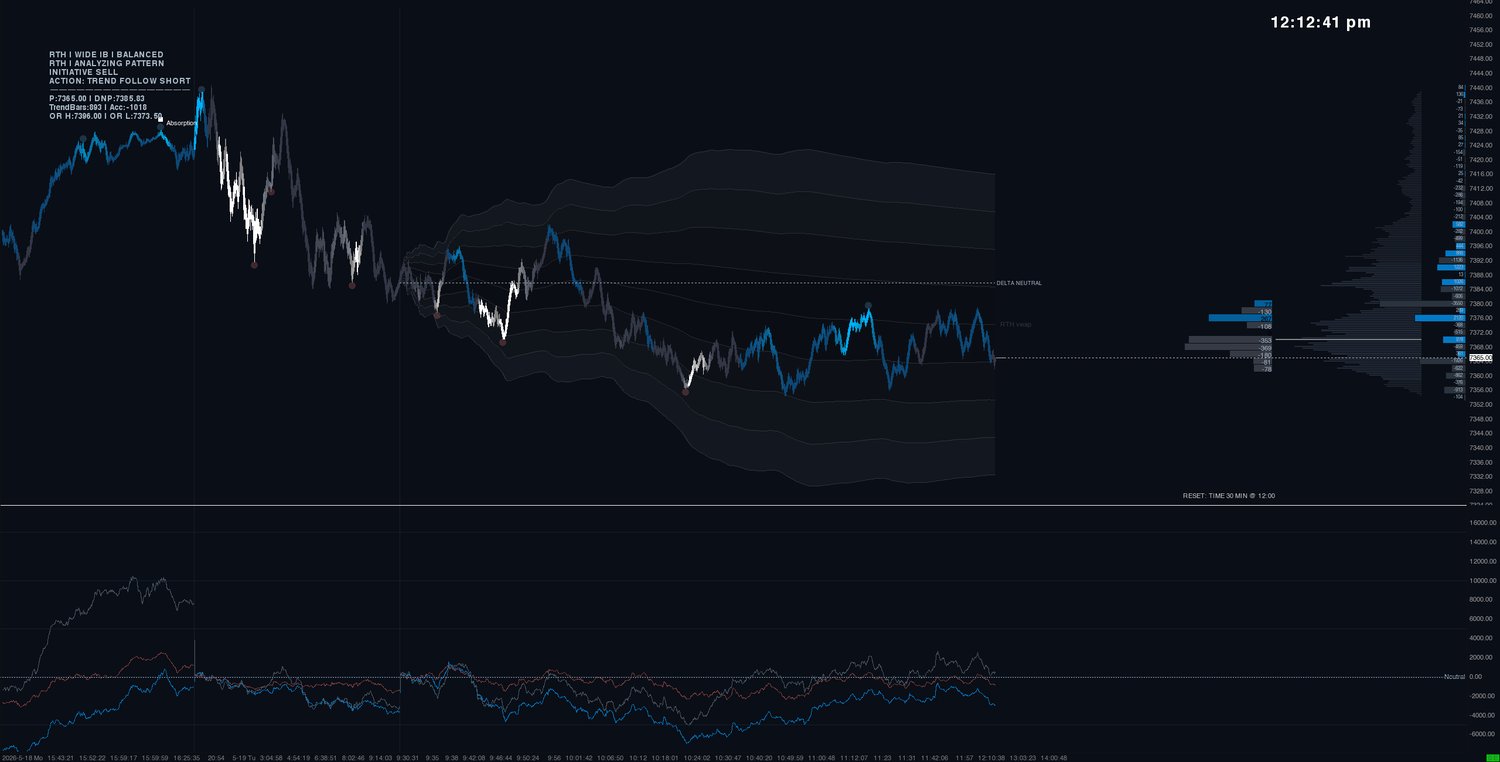
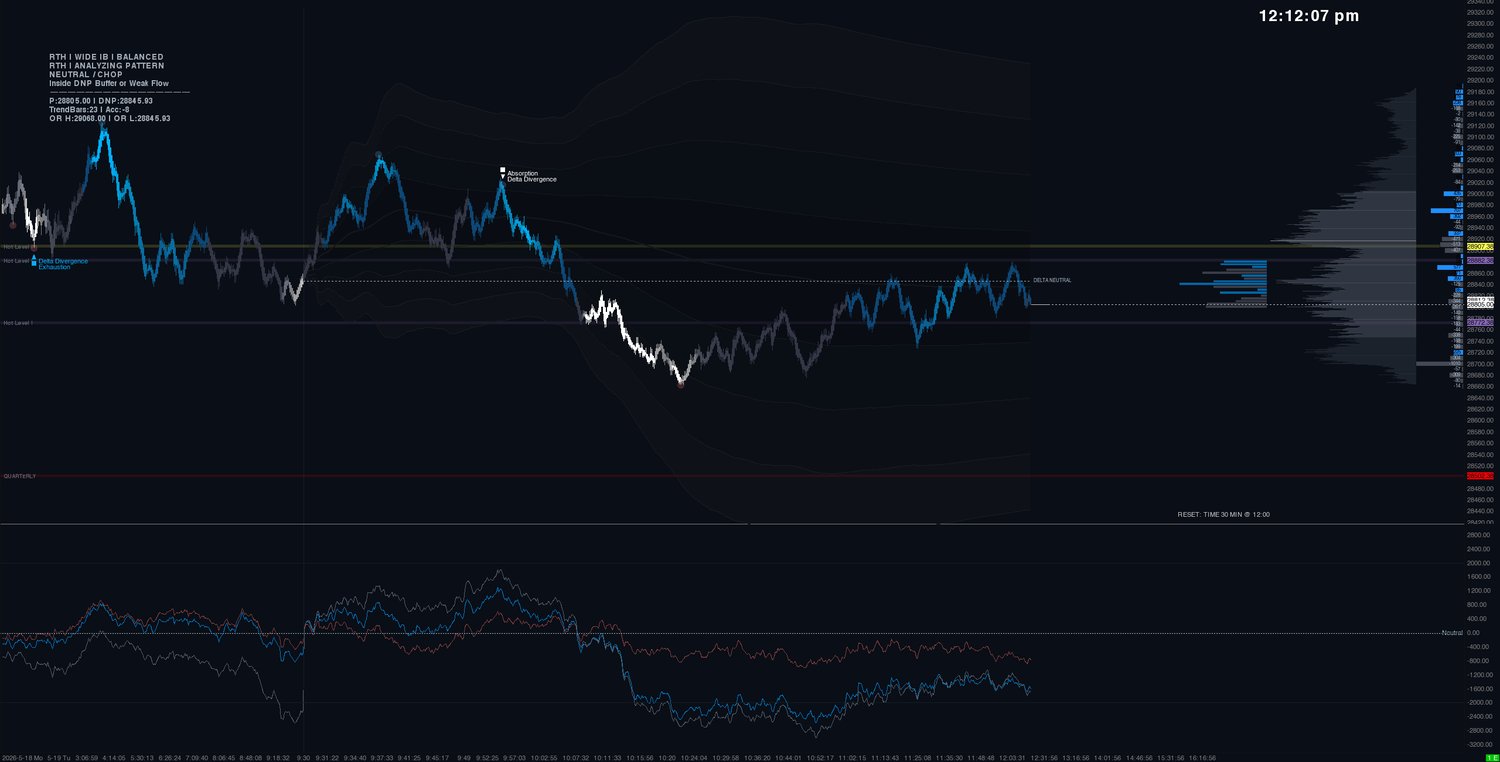

Just dropped V2. Built strictly for active scalpers. Tighter rules. Faster signals. Made to catch quick moves right as they happen. You get both V1 and V2 with your access.
Look, let’s be real. Most trading setups are just full of random lines and noise that give you analysis paralysis. You end up staring at lagging indicators, guessing if a move is real, or getting chopped up because you didn’t see a big institutional block hit the tape.
The TradeWithIce Orderflow Suite fixes that. No corporate BS, no over-complicated formulas. It’s a clean package built for Sierra Chart that filters out the trash so you only see what actually matters: intent, market structure, and clear levels to trade off of.
Here is what's inside:
This is the brains of the setup. Instead of making you squint at raw numbers flashing a million miles an hour, it breaks the market down across Trend, Accumulation, Structure, and Time.
Forget standard moving averages that lag behind. This tracks volume-weighted value across multiple timeframes all at once.
Stop guessing where traders are trapped. This gives you a crystal-clear look at exactly where volume and delta are stacking up during the session. You can instantly spot heavy liquidity walls, volume clusters, or thin gaps where price is going to absolutely fly through.
When things get fast, you can't be looking away from your price ladder. This tool highlights major order flow imbalances and massive size shifts right on your DOM. You’ll see the exact second a whale steps into the book or pulls their orders so you can time your entry perfectly.
A simple, clean visual overlay that changes color based on aggressive market orders. It essentially highlights real momentum shifts for you. You'll know right away if a move has actual aggressive buying/selling behind it or if it's just low-volume retail noise.
This tool maps out aggregate market commitment across the day and cleans up your candles based on pure order flow bias.
See the large aggressive orders hitting the tape. This study tracks and visualizes massive market orders as they happen, right on your chart.
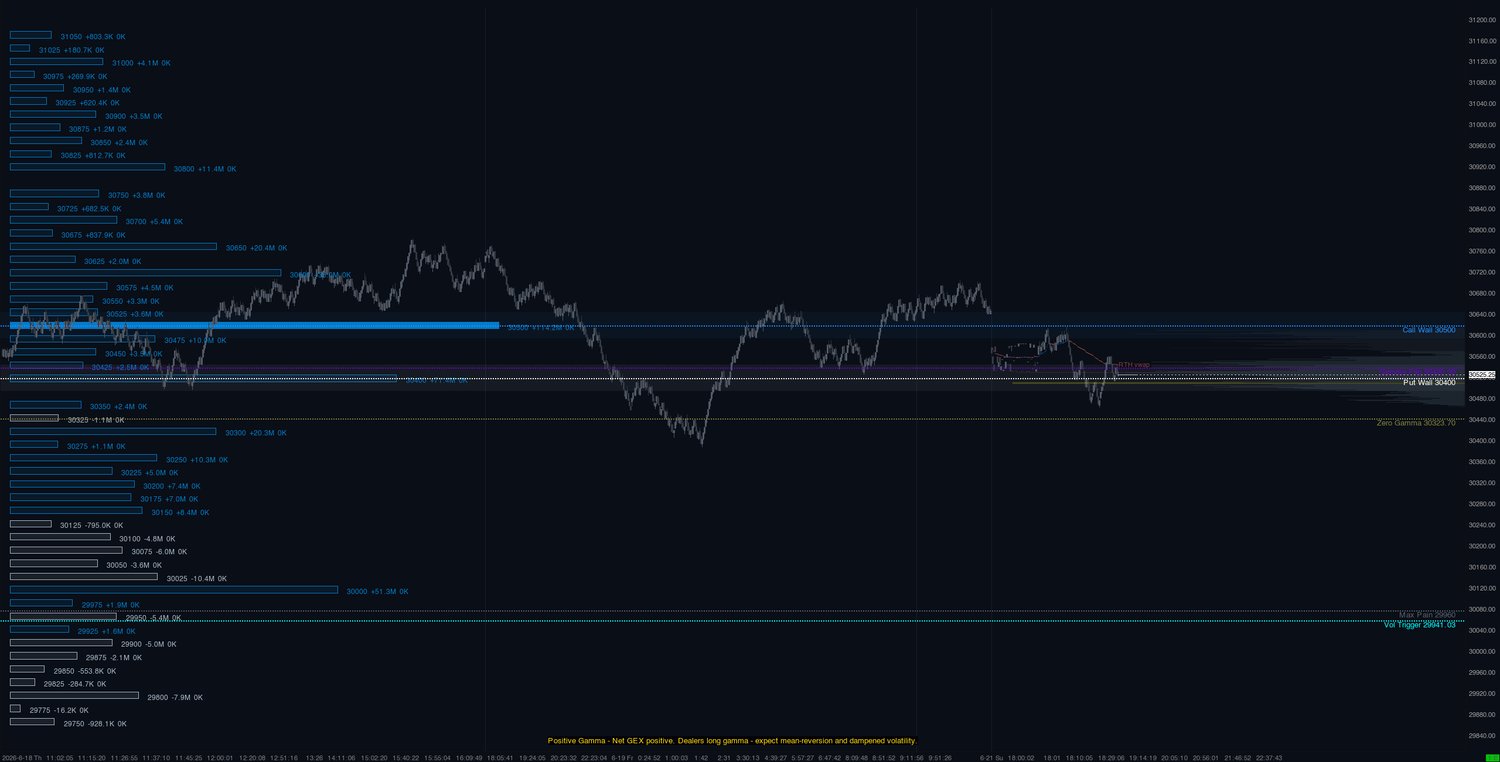
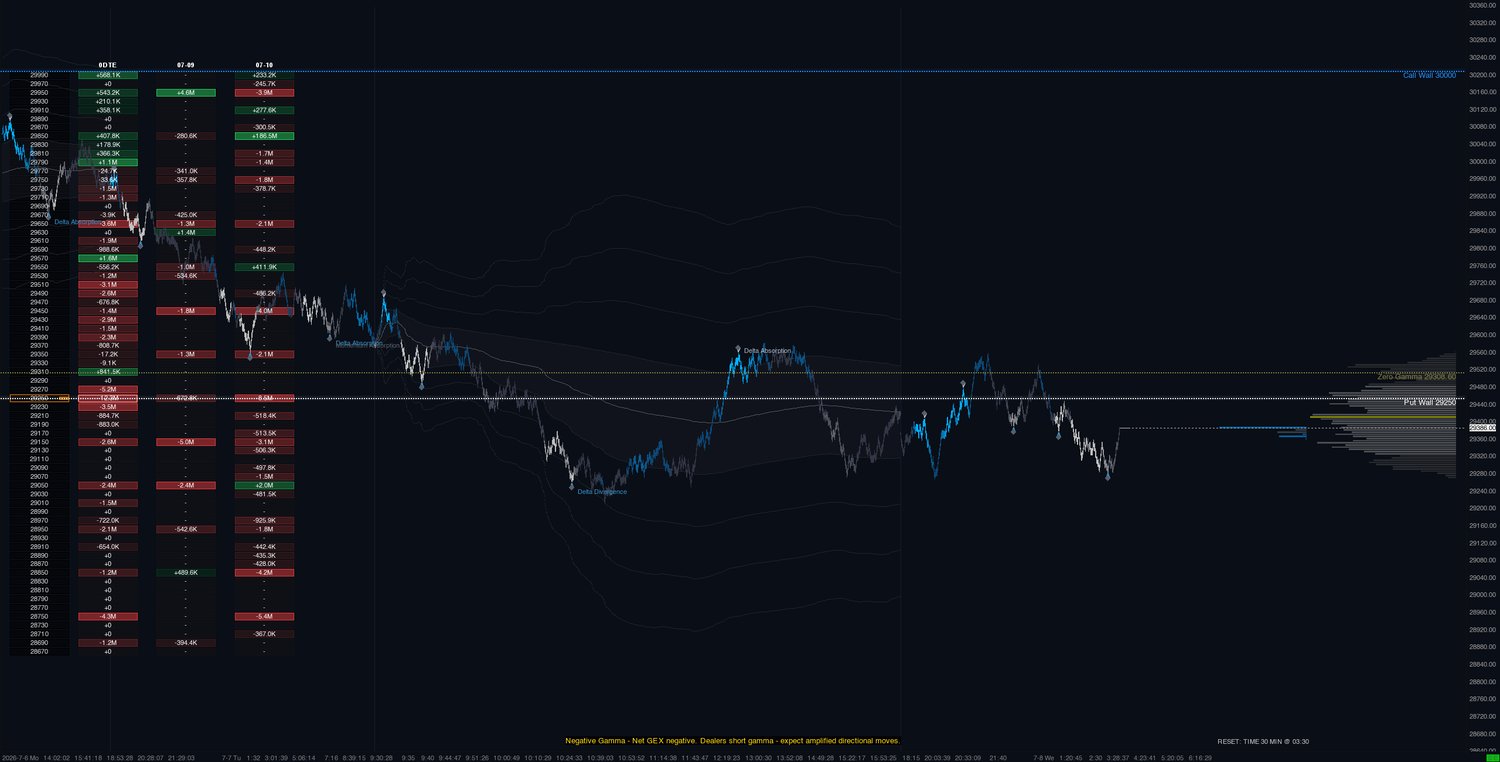
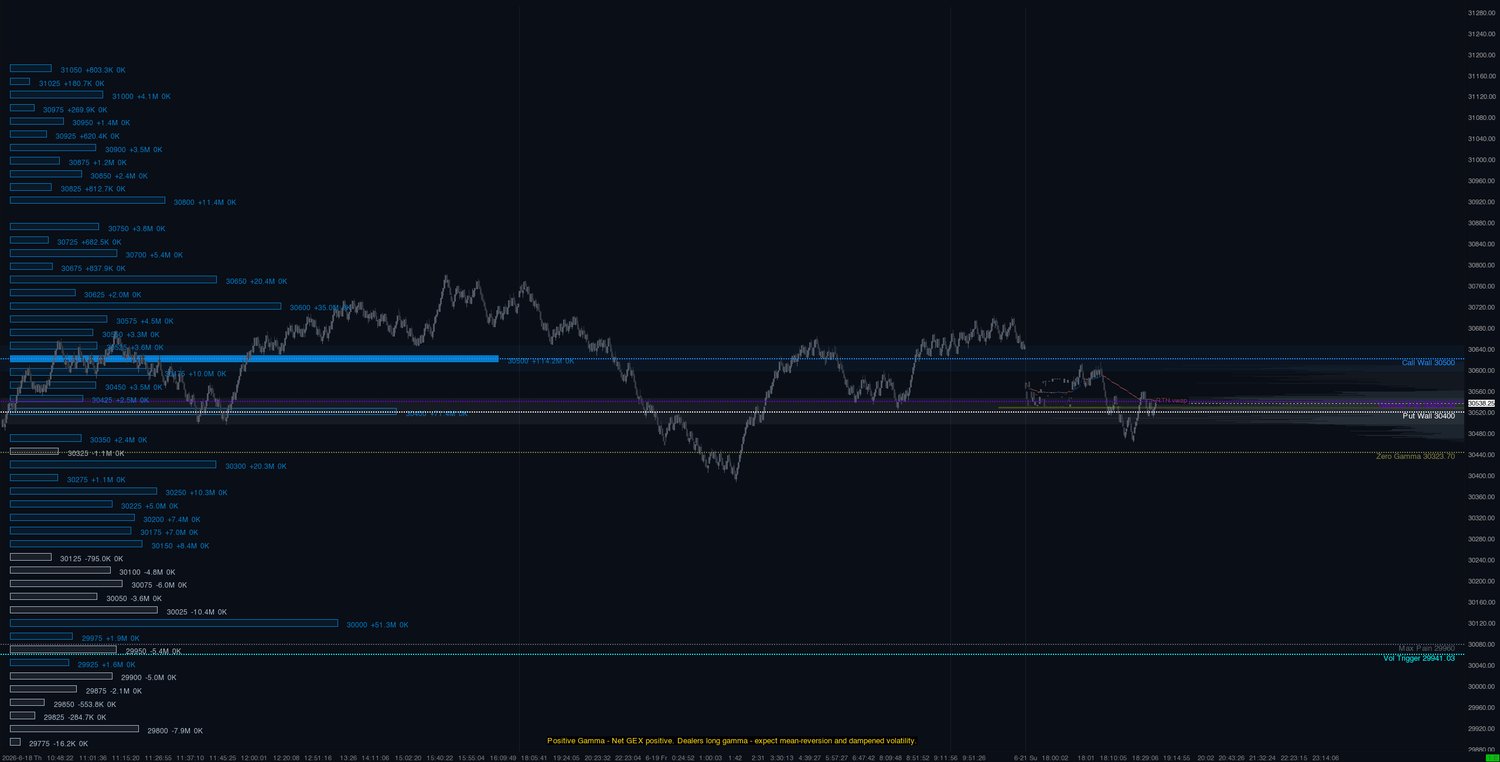
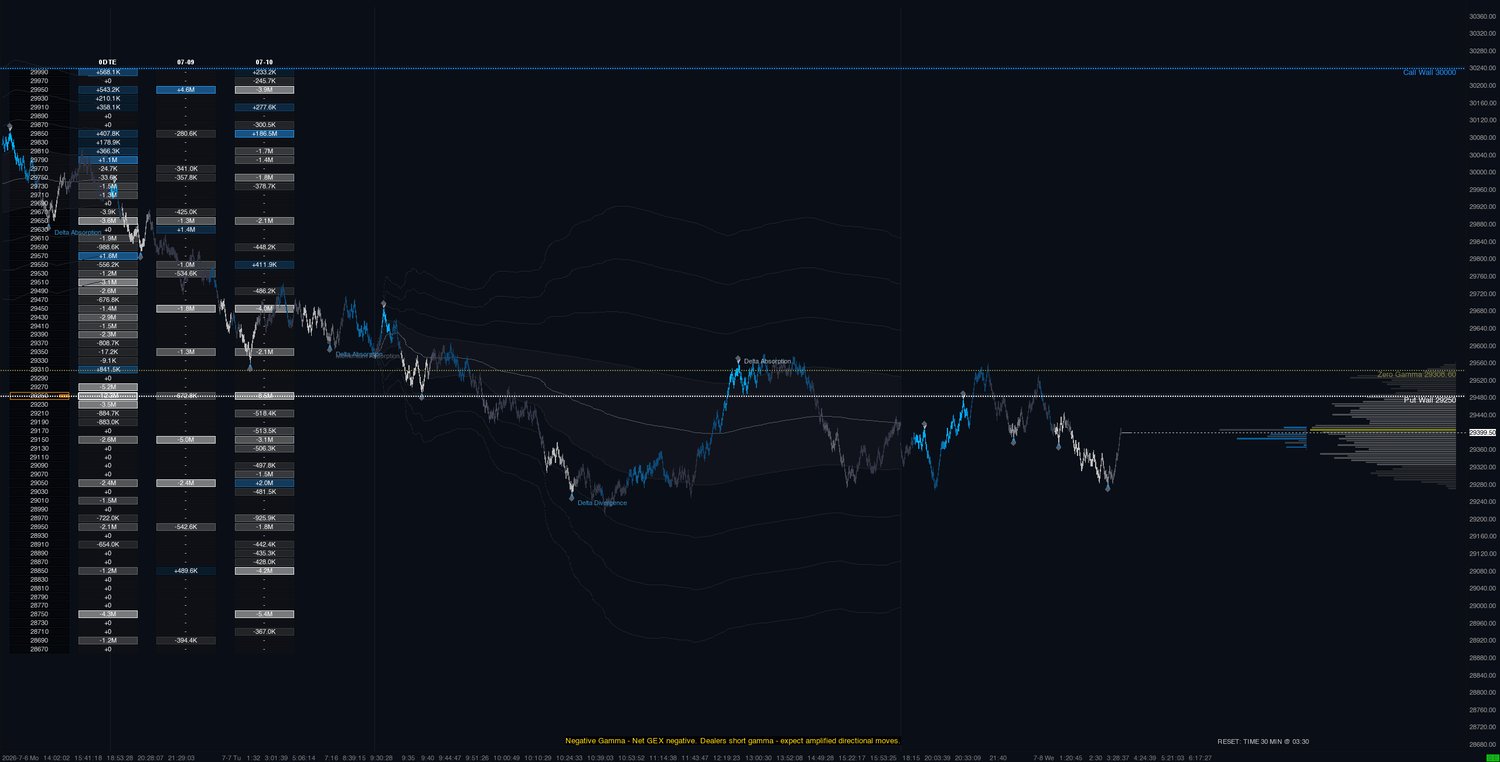
Options market makers hedge their books — and that hedging quietly shapes price action. GEX plots live gamma exposure levels straight onto your futures chart: call walls, put walls, and the gamma flip point. Above the flip, dealers tend to dampen moves and price gets pinned. Below it, they amplify them and moves can run further and faster than usual. Know which regime you're trading in before you take the trade.
146 liquid optionable tickers — index products, sector/commodity/bond ETFs, and mega-cap single stocks. Index products (SPX, NDX, SPY, QQQ) have daily expirations. Everything else has weekly (Friday) + monthly expirations.
IV note: index symbols anchor their IV level to the published vol index (VIX/VXN/GVZ, sanity-guarded); all other tickers anchor to their realized volatility. The relative skew shape and per-strike call/put basis are preserved.
SUBSCRIPTION REQUIRED
It’s built by a trader, for traders. No useless fluff—just heavy-duty execution tools designed to keep you on the right side of the tape.
Clean up your charts and grab the full suite here.
i'd love to hear from you! Send it to me using this form for any questions or comments.