
Investment & Dividend Tracker (Excel)
What it's worth. What it pays you. All in one place.
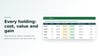
Every holding across your brokerage, IRA, and 401(k), with what you paid, what it's worth now, your gains, and every dividend. Plus your estimated yearly income. No macros.
WHAT IT DOES
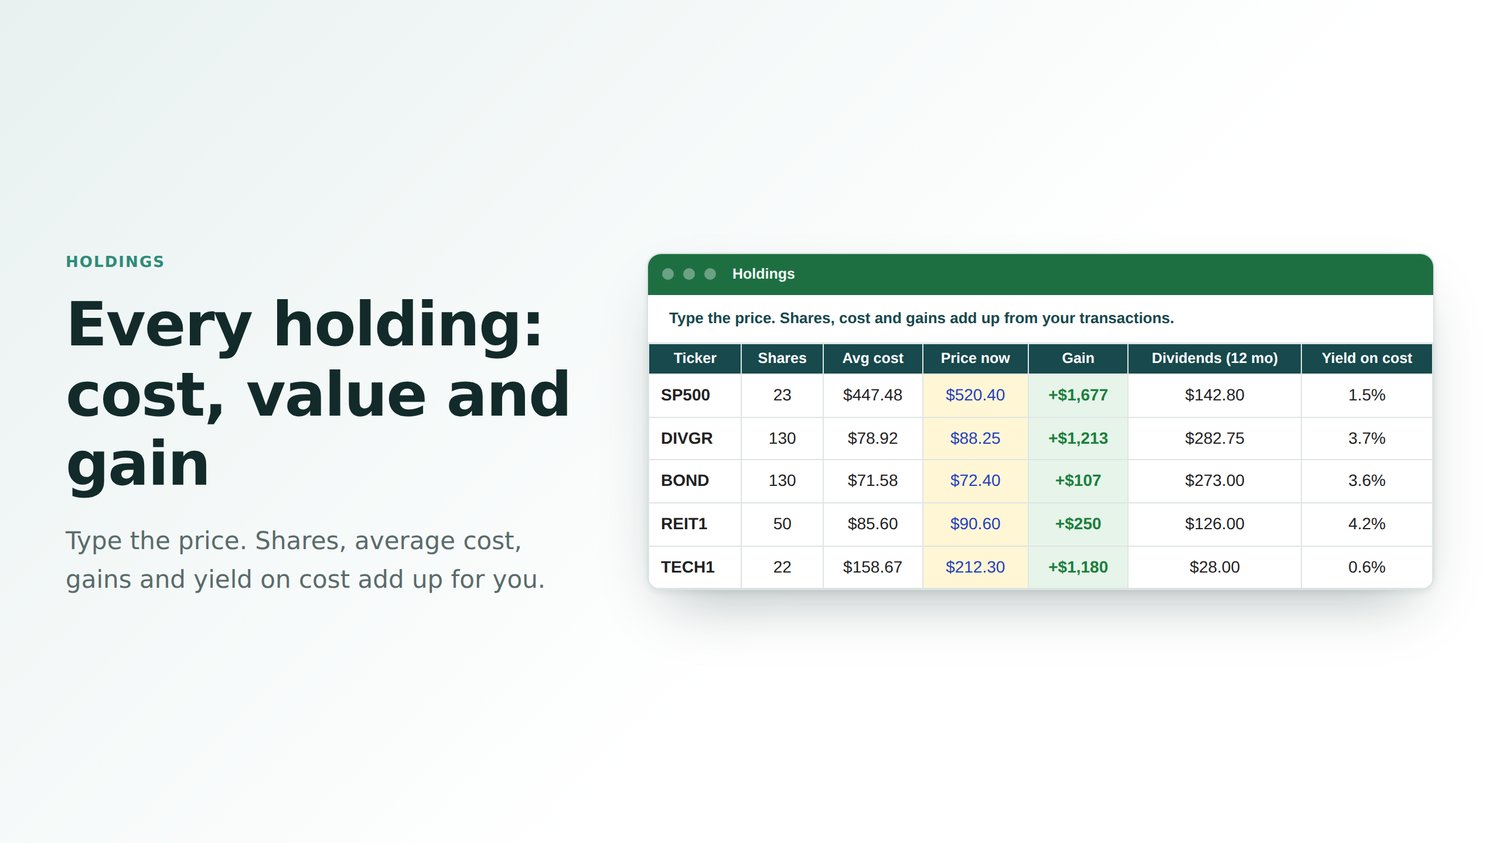
• Holdings list for up to 40 investments: stocks, ETFs, bond funds, REITs and cash
• Shares and average cost worked out from your buys and sells
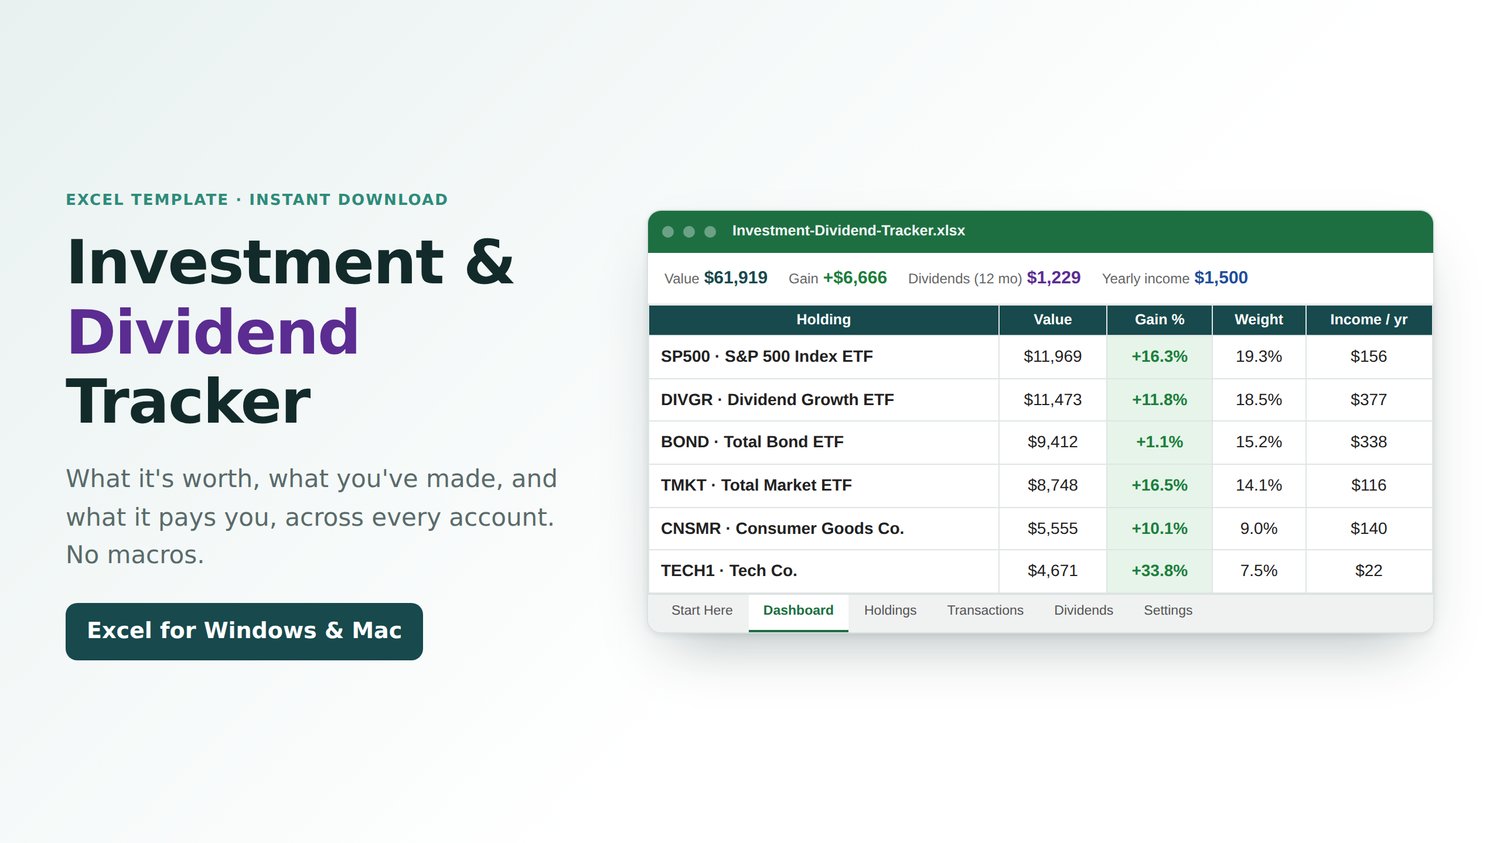
• Value, gain, gain % and weight of each holding
• Transactions log for buys and sells, with fees (room for 1,000)
• Dividends log with a reinvested check
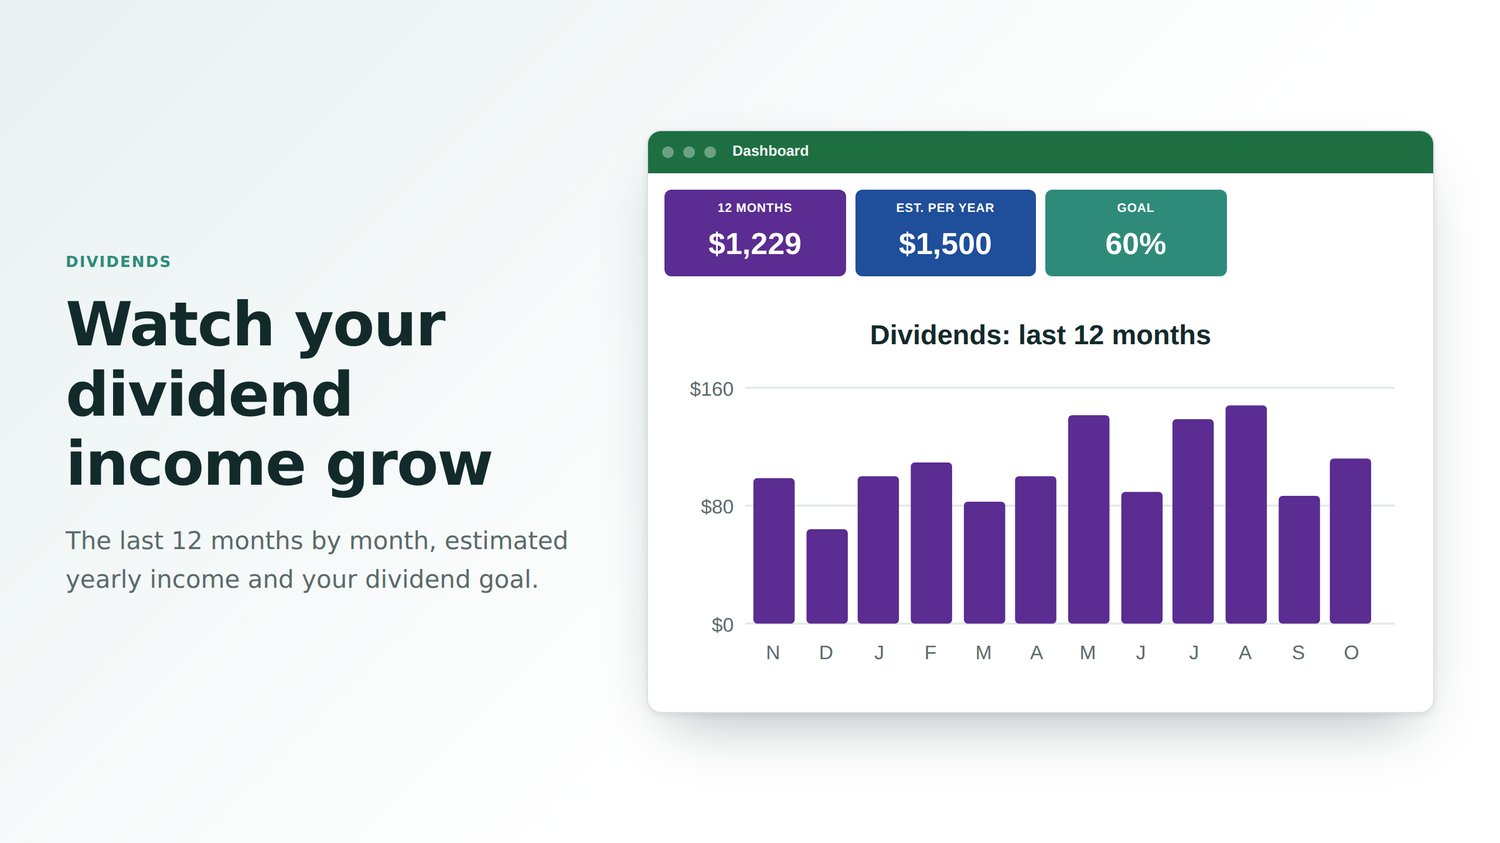
• Dividends over the last 12 months and yield on cost for each holding
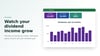
• Estimated yearly dividend income, and a dividend goal with progress bar
• Dashboard: portfolio value, gain, top holdings, allocation by type and a monthly dividends chart
• Works across accounts: brokerage, Roth IRA, 401(k) or your own
• Start Here guide and example portfolio
WHO IT'S FOR
DIY investors: dividend investors, index fund investors, and anyone with more than one account.
GOOD TO KNOW
• Prices aren't live: you type the latest price when you check in
• Nothing connects to your broker
• For tracking only: not investment advice. The example holdings and prices are made up
• Works in Microsoft Excel: Microsoft 365, Excel 2010 or later on Windows, and Excel for Mac
• Normal .xlsx file: no macros to enable
• One-off payment, instant download
Made by Lee at Sheet Leveller, whose tutorials have been watched 6.3 million times on YouTube.