

🔥 Track Safety at a Glance with One Simple Dashboard — Your INCIDENT/UNSAFE ACT Pie Chart Solution 🔥
🔥 Track Safety at a Glance with One Simple Dashboard — Your INCIDENT/UNSAFE ACT Pie Chart Solution 🔥
Need an instant, visual way to monitor safety performance and keep your team alert? This ready‑to‑use Incident/Unsafe Act Dashboard (Excel + Google Sheets) gives you a sleek pie‑chart display that tells the story of your safety metrics in seconds.
👀 What you’ll see:
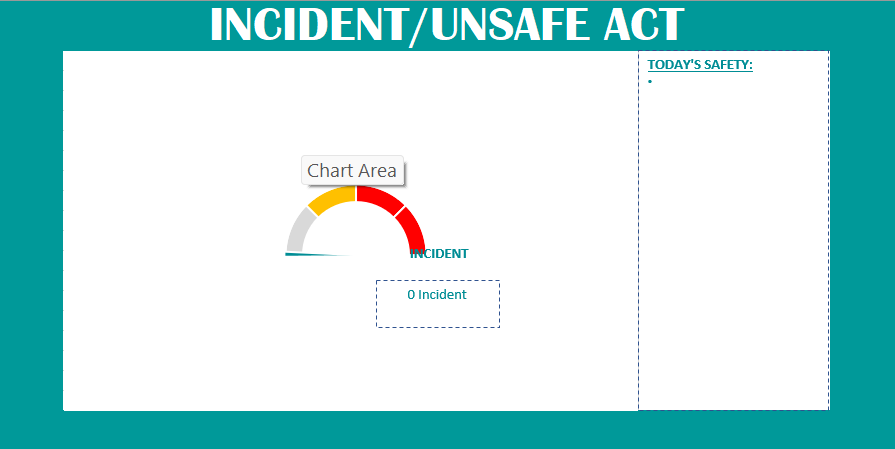
- Dynamic Pie Chart: A colorful “Chart Area” split into segments (grey – no data/neutral, yellow – caution, red – incident) with a clear indicator of 0 Incidents today.
- Today’s Safety: Dedicated panel highlighting real‑time status – perfect for daily briefings or safety huddles.
- All‑in‑One Sheet: No complicated setups – just open, input data, and let the chart do the work.
💼 Ideal for: Safety officers, supervisors, HR teams, or any organization serious about fostering a proactive safety culture.
✅ Benefits:
✔️ At‑a‑glance insights Spot trends instantly with the visual pie chart.
✔️ Easy data entry Simple fields update the chart automatically.
✔️ Customizable Tailor colors, labels, and segments to match your safety standards.
✔️ Quick reporting Copy‑paste charts into presentations or daily reports in seconds.
🚀 Empower your team with clear, actionable safety data grab the Incident/Unsafe Act pie‑chart dashboard today and keep safety front‑and‑center!