
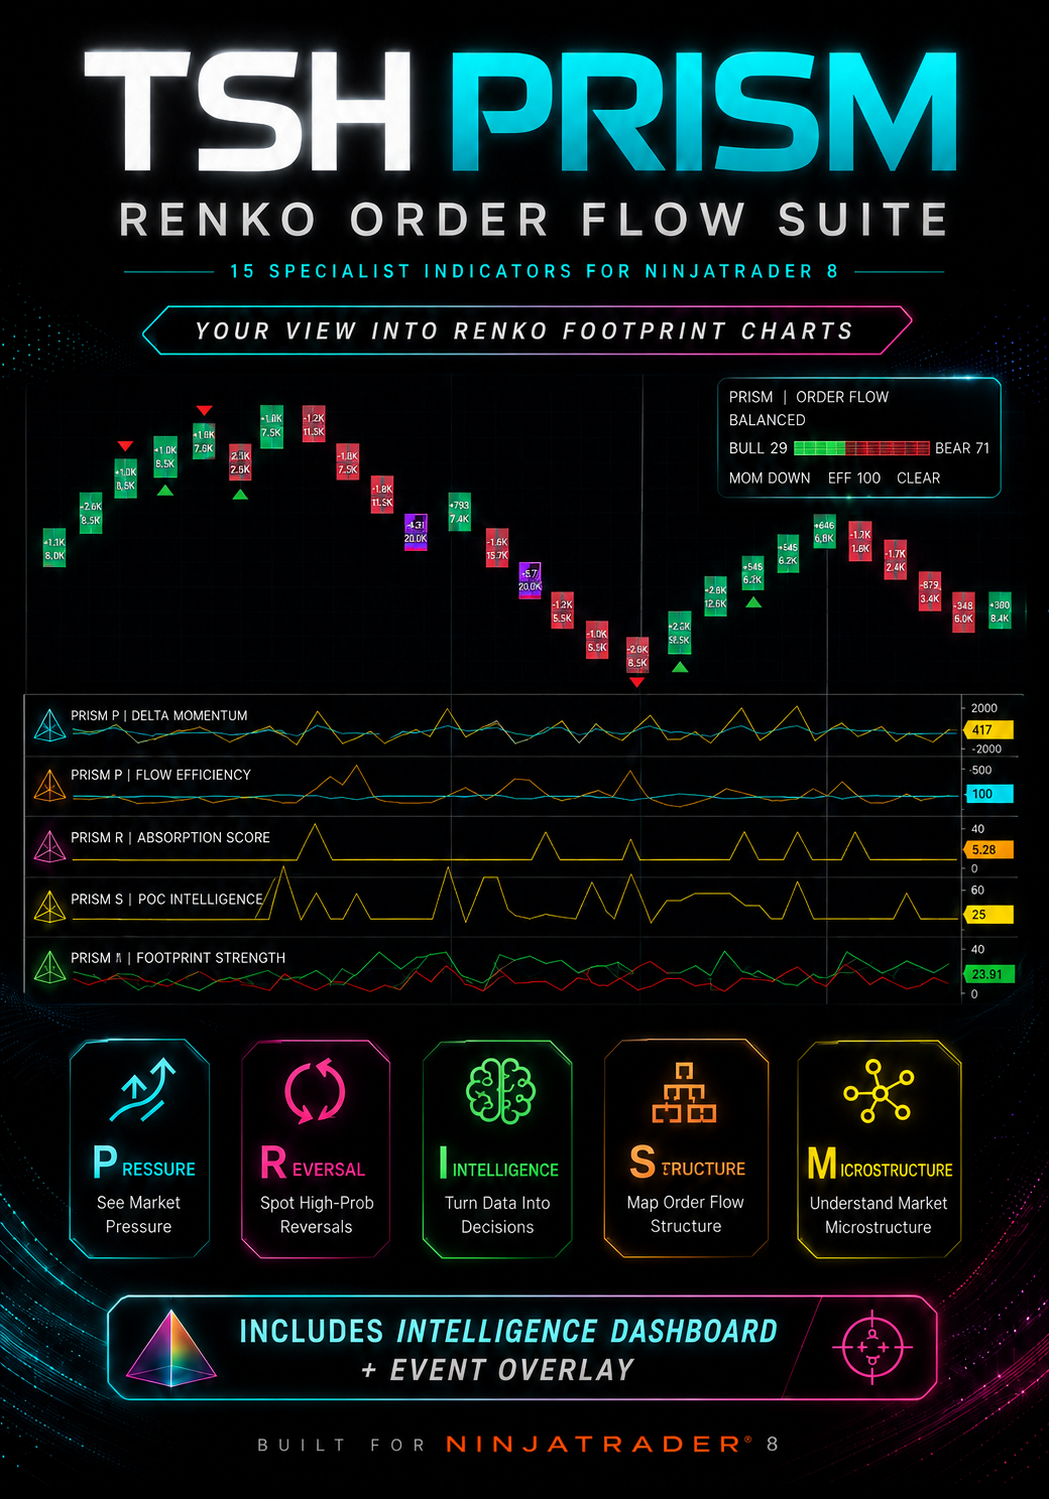
TSH PRISM Renko Footprint Charts Order Flow Indicator Suite
PRISM – Renko Order Flow Suite for NinjaTrader 8
Turn Renko Footprint Data Into Objective Trading Intelligence
15 specialist Renko Order Flow indicators. One integrated trading ecosystem.
Renko charts are excellent at showing price structure.
Footprint charts reveal what happened inside that structure.
PRISM takes the next step.
Instead of forcing you to manually interpret Delta, volume, imbalances, Point of Control, absorption and other order-flow information, PRISM converts that information into a range of objective measurements, scores, signals and market states designed specifically around Renko Footprint trading.
This is not a collection of conventional indicators copied onto a Renko chart.
PRISM has been developed around the particular characteristics of Renko + footprint/order-flow data.
What Is PRISM?
PRISM stands for:
P | Pressure
R | Reversal
I | Intelligence
S | Structure
M | Microstructure
Together these five areas form a new analytical layer for the TSH Renko Footprint Charts.
PRISM gives you 15 specialist indicators, together with a unified Event Overlay and Intelligence Dashboard.
You can use the individual indicators for detailed analysis and research...
...or use the streamlined PRISM interface to reduce all that information into a much simpler view of what is happening inside the market.
PRISM Intelligence Dashboard
You don't need 15 indicators covering your screen.
PRISM includes a compact Order Flow Intelligence Dashboard designed to give you an immediate snapshot of the current Renko environment.
It can show information such as:
Market Regime
BULL AGGRESSIVE / BEAR AGGRESSIVE / BALANCED / EXHAUSTION / ACTIVITY GAP etc.
Bull vs Bear Strength
For example:
BULL 78 | BEAR 22
Momentum
RISING / FALLING / FLAT
Flow Efficiency
A 0–100 assessment of how efficiently order flow is producing Renko price movement.
Current PRISM Alert
Including potential absorption, exhaustion or hidden Renko activity gaps.
The objective is simple:
Turn complicated footprint information into something you can understand quickly.
15 PRISM Indicators Included
P | PRESSURE
1. PRISM Delta Momentum
Looks beyond raw Delta and measures how footprint Delta itself is changing.
Designed to help identify:
- strengthening order-flow pressure
- weakening pressure
- Delta acceleration
- Delta deceleration
- potential momentum changes
Includes adjustable lookback and signal thresholds.
2. PRISM Order Flow Pressure
Measures the balance of aggressive buying and selling inside the Renko footprint.
It also looks at whether that pressure is persisting across multiple Renko bricks.
Potential uses include:
- confirming directional moves
- identifying weakening trends
- measuring sustained buying/selling pressure
- filtering other Renko signals
3. PRISM Flow Efficiency
One of the more unusual PRISM concepts.
A Renko brick represents a defined amount of price movement.
That allows us to ask:
How much order-flow effort was required to create that fixed amount of movement?
If increasingly large volume or Delta is required to move price the same Renko distance, the character of the move may be changing.
PRISM Flow Efficiency allows the user to analyse effort using:
- Total Volume
- Delta
- A blended measure
Potential uses include trend quality, exhaustion research and identifying changing market efficiency.
4. PRISM Continuation Pressure
A 0–100 score designed to measure how strongly current order flow supports continuation in the direction of the Renko move.
Potential uses:
- trend continuation
- pullback entries
- breakout confirmation
- filtering weak Renko signals
S | STRUCTURE
5. PRISM POC Intelligence
Takes Point of Control analysis beyond simply displaying the POC inside each footprint brick.
PRISM analyses:
- where the POC sits inside the brick
- whether POCs are migrating higher or lower
- how activity is moving through Renko structure
Potential uses include trend acceptance, continuation and identifying changing areas of market activity.
6. PRISM Renko Activity Gap
One of PRISM's most distinctive features.
Traditional Renko construction can visually hide price gaps because Renko bricks are created to represent the movement between prices.
Footprint data allows us to investigate whether price actually traded throughout those intermediate levels.
PRISM can identify:
- multi-brick events
- untraded price levels
- contiguous hidden price gaps
- gap size in ticks
- Gap Severity from 0–100
This creates a completely new way of investigating something that conventional Renko charts can hide from the trader.
7. PRISM Pullback Quality
Compares the order-flow pressure inside a Renko pullback with the directional impulse that preceded it.
Instead of simply saying:
"This looks like a weak pullback."
PRISM attempts to quantify it.
Potential uses:
- continuation setups
- determining whether counter-trend pressure is becoming dangerous
- distinguishing shallow order-flow corrections from stronger reversals
8. PRISM Breakout Quality
Not every Renko breakout is equal.
PRISM Breakout Quality combines the structural break with the order-flow activity accompanying it.
It produces a 0–100 quality score and separates:
No Breakout
from:
A breakout with weak or strong order-flow confirmation.
Potential uses:
- range breakouts
- Opening Range Breakouts
- Donchian-style breakouts
- false-break research
- breakout filtering
R | REVERSAL
9. PRISM Delta Divergence
Objectively identifies disagreement between Renko price movement and footprint Delta.
Signals include:
+1 Bullish Divergence
0 No Divergence
-1 Bearish Divergence
PRISM can also identify the first new divergence signal, helping prevent repeated alerts during an existing divergence condition.
10. PRISM Absorption Score
Absorption normally requires the trader to visually interpret footprint numbers.
PRISM converts the concept into an objective:
0–100 Absorption Score
Potential factors include:
- opposing Delta
- relative volume
- pressure
- Renko direction
- failure of aggressive activity to produce expected price progress
Potential uses include reversal research, support/resistance behaviour and filtering exhaustion signals.
11. PRISM Exhaustion Score
A 0–100 measure designed to identify potential deterioration in the pressure behind an existing Renko move.
It considers both:
- climactic activity
- declining/stalling pressure
Potential use:
Identifying when a trend may still be moving in one direction while the order flow underneath it is beginning to change.
12. PRISM Reversal Pressure
A composite 0–100 reversal measure combining several forms of order-flow deterioration.
This can include:
- absorption
- exhaustion
- conflicting Delta
- weakening directional pressure
It is designed to provide a broader assessment than any single reversal indicator.
M | MICROSTRUCTURE
13. PRISM Imbalance Engine
Automatically analyses the bid/ask footprint inside individual Renko bricks.
Includes:
- bullish imbalance density
- bearish imbalance density
- diagonal imbalance
- stacked imbalance
- net stacked pressure
Users can adjust the imbalance ratio and the number of stacked levels required.
This converts information that footprint traders normally inspect manually into objective numerical data.
I | INTELLIGENCE
14. PRISM Order Flow Regime
PRISM attempts to classify the current Renko order-flow environment into meaningful states.
Examples include:
- Bull Aggressive
- Bull Pressure
- Bull Weak
- Balanced
- Bear Weak
- Bear Pressure
- Bear Aggressive
- Exhaustion
- Activity Gap
This gives traders a higher-level view of what the different footprint components are collectively suggesting.
15. PRISM Footprint Strength
The flagship PRISM composite.
Instead of forcing you to interpret multiple independent footprint measurements, PRISM combines information into a simple Bull/Bear strength assessment.
For example:
BULLISH PRESSURE: 78/100
BEARISH PRESSURE: 22/100
Inputs may include:
- Delta
- pressure
- imbalance
- stacked imbalance
- POC
- Delta momentum
- absorption
- exhaustion
The purpose is not to tell you blindly to buy or sell.
It is to provide a consistent objective framework for assessing the order-flow environment behind the Renko structure.
PRISM Event Overlay
PRISM also includes a unified chart overlay.
Instead of loading numerous separate visual indicators, traders can choose to display important PRISM events directly on the Renko Footprint chart.
The overlay can identify:
- bullish Delta divergence
- bearish Delta divergence
- potential absorption
- potential exhaustion
- hidden Renko Activity Gaps
- POC migration
Three workspace styles are available:
Clean
Designed for everyday trading. Only the strongest and most important events are displayed.
Standard
Provides additional analytical information while keeping the chart relatively uncluttered.
Research
Designed for traders investigating PRISM behaviour in greater detail.
Flexible – Not Locked Down
Different traders trade different markets, block sizes and styles.
PRISM has therefore been designed to be configurable.
Many indicators allow users to adjust parameters including:
- lookback periods
- signal thresholds
- pressure thresholds
- imbalance ratios
- stacked imbalance levels
- Gap Severity
- gap size
- breakout thresholds
- strength thresholds
- sensitivity
Where appropriate, PRISM also includes:
Conservative
Fewer, stronger signals.
Balanced
Recommended default.
Aggressive
More responsive.
Custom
Allows greater control over the underlying parameters.
Designed for Research and Backtesting
A major objective behind PRISM was to convert concepts that are normally interpreted visually into numerical data.
Instead of:
"There seems to be absorption."
PRISM can produce:
Absorption Score = 78
Instead of:
"That breakout looks strong."
PRISM can produce:
Breakout Quality = 82
This creates the possibility of using PRISM measurements for:
- NinjaTrader Strategy Analyzer research
- systematic strategy development
- signal filtering
- alerts
- optimisation
- automated trading research
The PRISM indicators expose numerical outputs specifically with this future systematic use in mind.
What Can You Use PRISM For?
PRISM has been designed as an analytical toolkit rather than a single trading strategy.
Possible areas of research include:
- Renko trend continuation
- Delta momentum
- footprint divergence
- absorption reversals
- exhaustion reversals
- stacked imbalance continuation
- POC migration
- breakout confirmation
- false breakouts
- weak pullbacks
- reversal pressure
- hidden Renko gaps
- order-flow regime analysis
- composite Bull/Bear pressure
You decide how those tools fit into your own trading methodology.
IMPORTANT – This Is a New Research Ecosystem
PRISM indicators are built around logical market and order-flow concepts.
They are not being sold as guaranteed predictive signals.
Part of the purpose of PRISM is to allow traders to objectively investigate ideas that previously had to be judged visually.
I will also be carrying out extensive ongoing testing and research into PRISM concepts through The Stop Hunter, including examining which indicators and combinations provide useful information across different futures markets and Renko block sizes.
Existing PRISM users will benefit from future development and improvements to the suite.
Platform Requirements
PRISM has been developed for:
NinjaTrader 8
and is specifically designed to operate with the:
TSH Renko Footprint Charts
PRISM uses the underlying footprint/order-flow information generated by the TSH Renko Footprint system.
You therefore need the TSH Renko Footprint Charts to use PRISM.
If you do not currently own the Renko Footprint Charts, consider the TSH Renko Footprint Pro Bundle, which combines the Footprint Charts and PRISM Order Flow Suite.
Included With Your Purchase
You receive:
✓ Complete PRISM Renko Order Flow Suite
✓ All 15 specialist PRISM indicators
✓ PRISM Event Overlay
✓ PRISM Intelligence Dashboard
✓ Clean / Standard / Research workspace modes
✓ Conservative / Balanced / Aggressive / Custom settings where appropriate
✓ User-adjustable indicator inputs
✓ Numerical outputs designed for research and automation
✓ PRISM User Guide
✓ Future PRISM v1.x updates
PRISM Renko Order Flow Suite:
£149
One-off purchase.
For NinjaTrader 8.
Designed exclusively for the TSH Renko Footprint trading ecosystem.
Renko gives you structure.
Footprint shows you the activity behind it.
PRISM turns that activity into intelligence.