
SPC Control Chart Toolkit — Excel (X̄-R, X̄-S, I-MR, p/np/c/u)
A ready-to-use statistical process control toolkit. Pick the right tab, fill the yellow cells, and watch the control limits and charts calculate live — no SPC maths, no setup.
**What's included (6 tabs):**
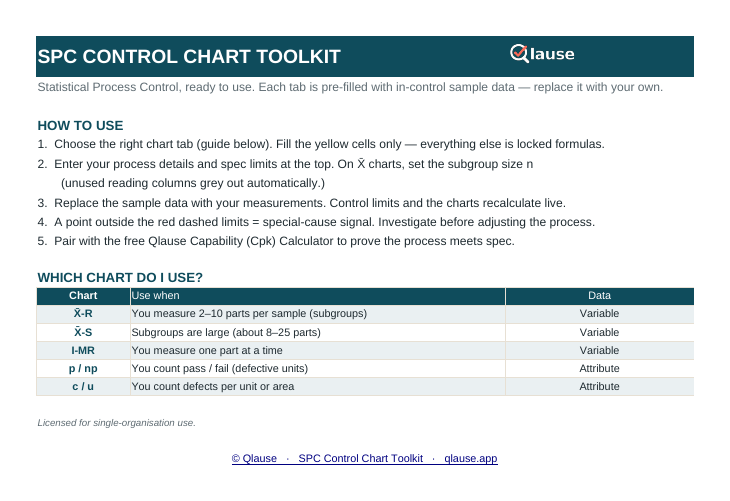
- Start Here guide — which chart to use, and how to read the signals
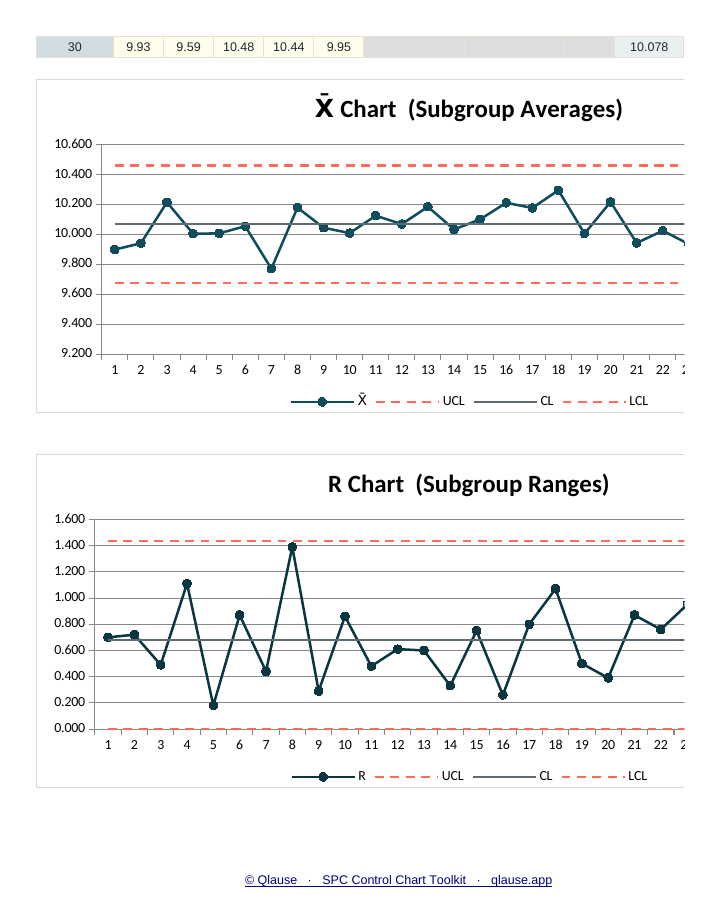
- X̄-R chart — averages & range, for subgroups of 2–10
- X̄-S chart — averages & standard deviation, for larger subgroups
- I-MR chart — individuals & moving range, for one-at-a-time data
- Attribute chart — p / np / c / u, switchable from a dropdown, for pass-fail and defect counts
- Built-in SPC constants table powering the formulas
**Why you'll like it:**
- Control limits (UCL / centre line / LCL) calculate automatically as you enter data
- Pre-formatted charts in a clean professional theme — present-ready
- Out-of-spec spec fields (USL / LSL / target) so you can compare to requirements
- Works in Microsoft Excel — no macros, no add-ins
Pairs perfectly with the free Qlause Cpk Calculator to prove your process meets spec.
Licensed for single-organisation use.