



Breakouts vs Fakeouts Explained — Measured (PDF Guide)
Price closes through a level you have been watching for days. You either take it and watch it come straight back, or you wait for confirmation and watch it leave without you. Both feel like the wrong choice afterwards, and nothing you have read tells you where the line between them is.
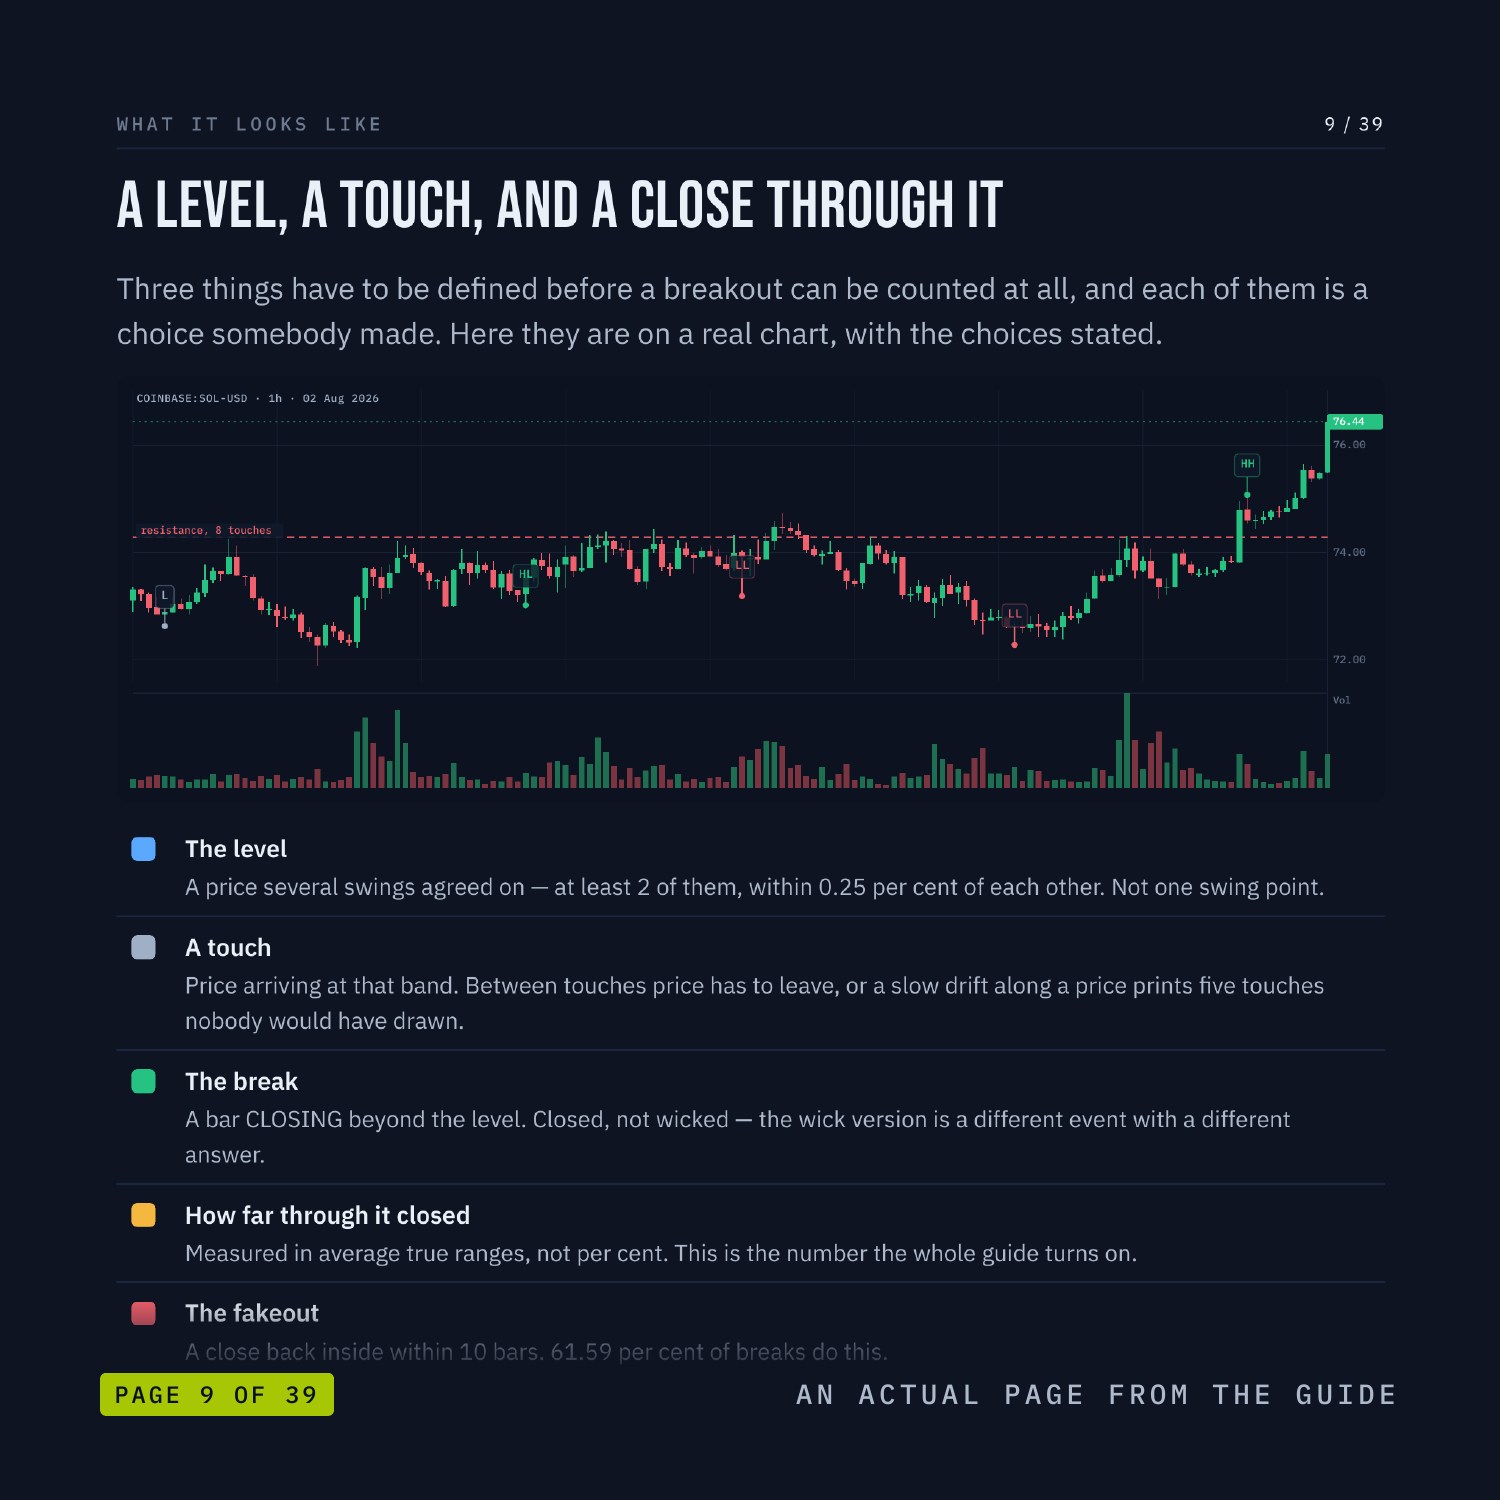
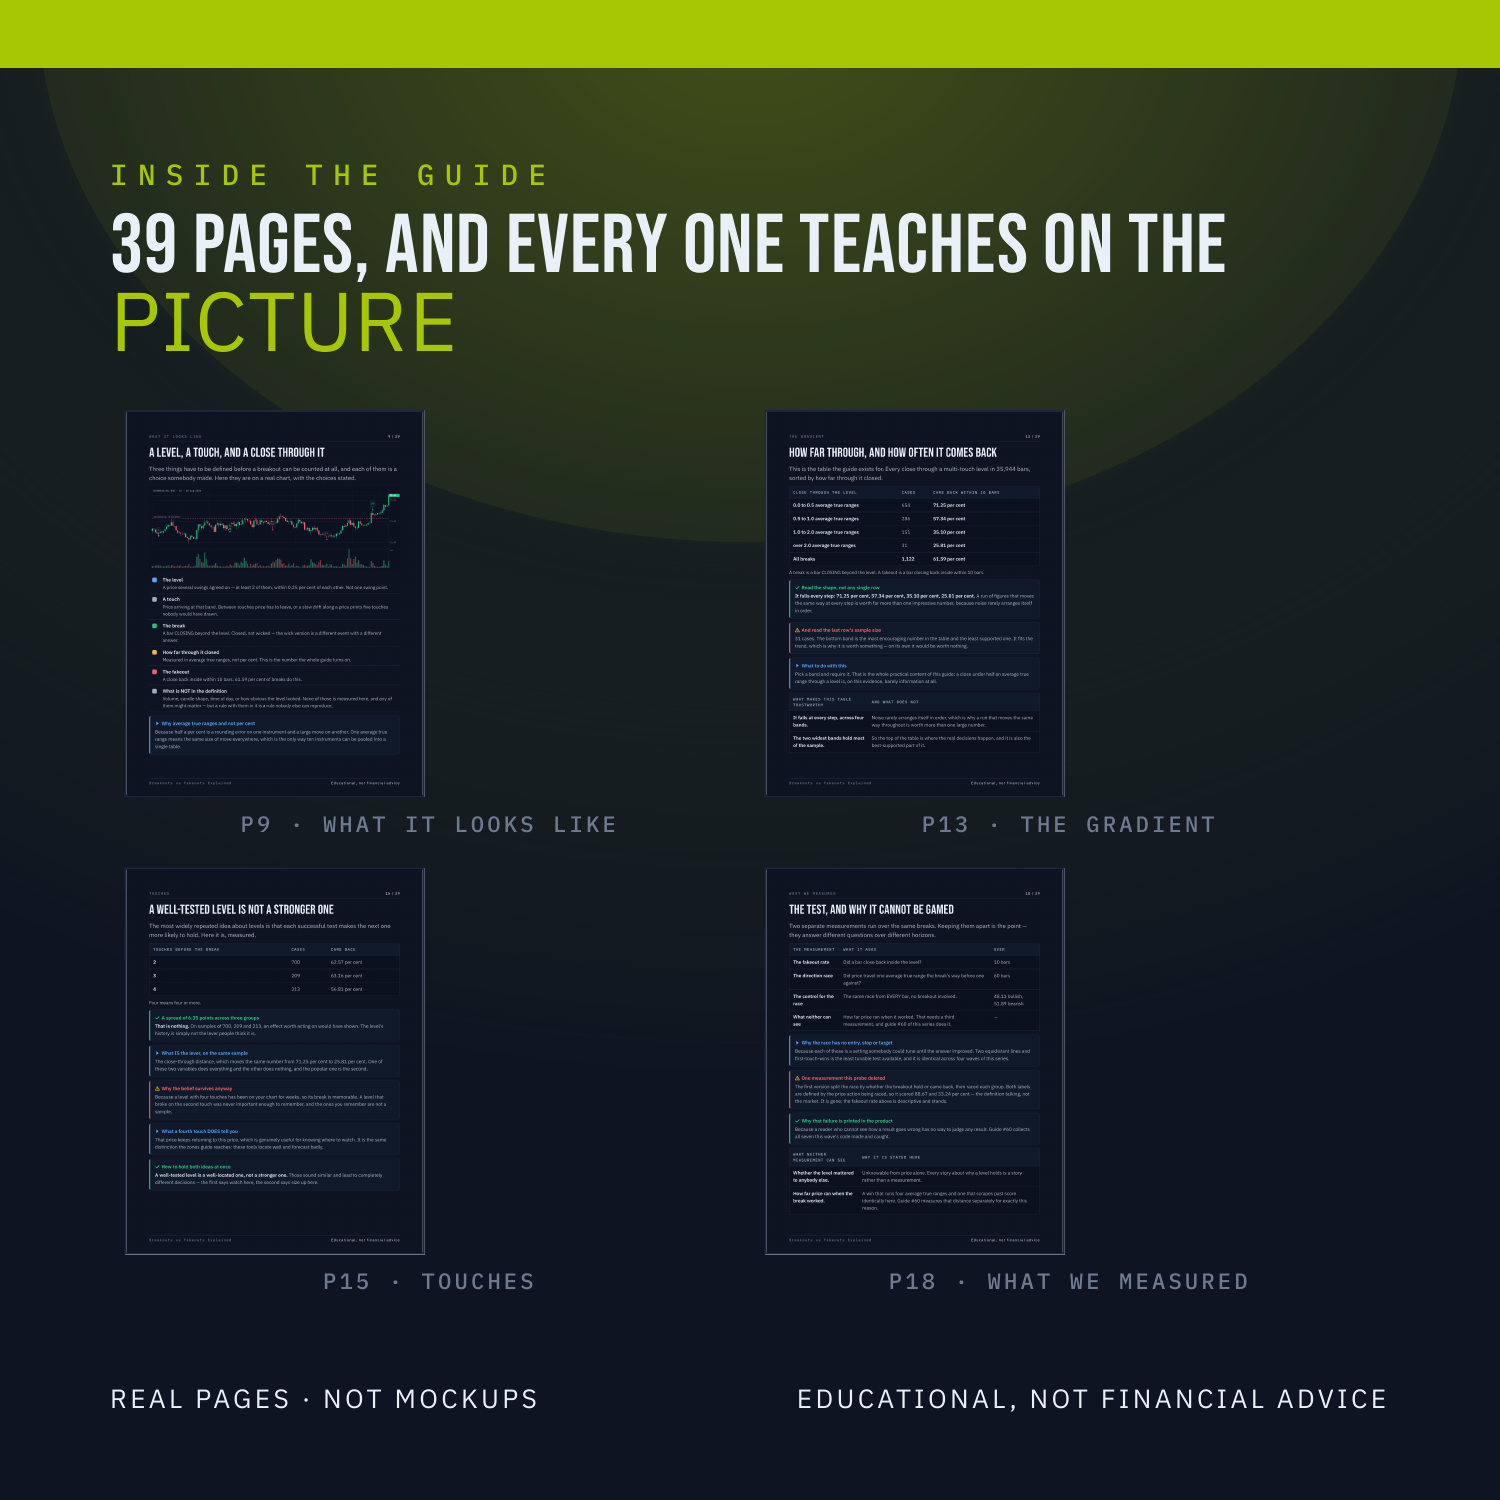
There is a line and it is measurable. Across 35,944 bars, every close through a multi-touch level was recorded along with how far through it closed and whether price closed back inside within 10 bars. The result is a table you can read off: the further through it closed, the less often it came back, every step of the way. This is a 39-page PDF that teaches Breakouts vs Fakeouts from the first thing you see on the screen through to a written strategy with an entry, a stop and an explicit rule for when the trade is wrong.
Nothing is taught underneath a chart. Every label sits on the candle, the line or the level it is describing, on real BTC, ETH, SOL and LINK charts. There are three quizzes on real charts, each followed by the same chart re-shown annotated with the reasoning, plus faded practice pages where the first steps are filled in and you finish the rest.
WHAT'S INSIDE
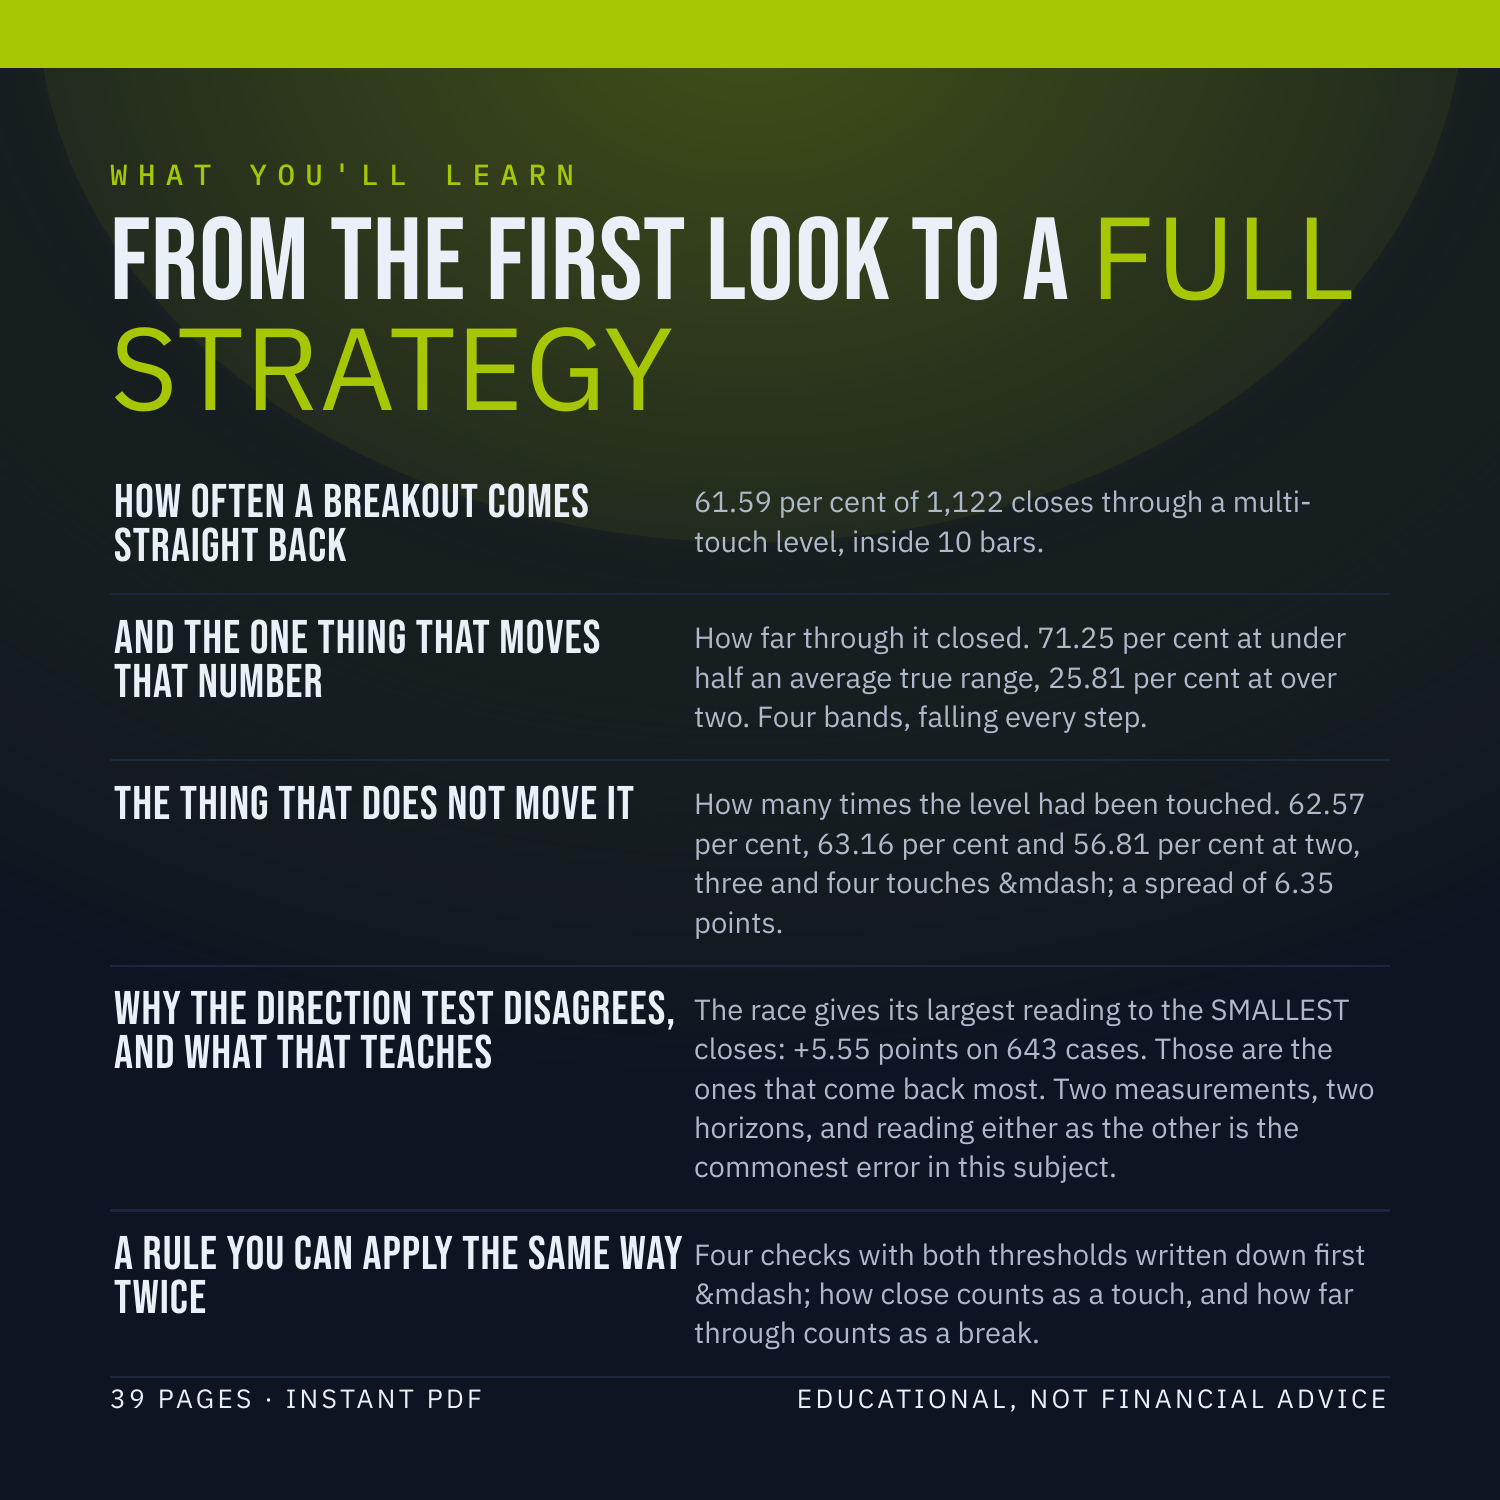
How often a breakout comes straight back - 61.59 per cent of 1,122 closes through a multi-touch level, inside 10 bars.
And the one thing that moves that number - How far through it closed. 71.25 per cent at under half an average true range, 25.81 per cent at over two. Four bands, falling every step.
The thing that does NOT move it - How many times the level had been touched. 62.57 per cent, 63.16 per cent and 56.81 per cent at two, three and four touches, a spread of 6.35 points.
Why the direction test disagrees, and what that teaches - The race gives its largest reading to the SMALLEST closes: +5.55 points on 643 cases. Those are the ones that come back most. Two measurements, two horizons, and reading either as the other is the commonest error in this subject.
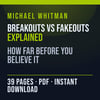
A rule you can apply the same way twice - Four checks with both thresholds written down first: how close counts as a touch, and how far through counts as a break.
WHAT YOU'LL BE ABLE TO DO
State how far through a level you require, before you look.
Read a fakeout rate with its close-through distance attached.
Stop treating a well-tested level as a stronger one.
Tell a 10-bar question from a 60-bar one.
Judge any breakout claim by its two thresholds.
AN HONEST NOTE
Breakouts vs Fakeouts is a clue, not a crystal ball. It describes what price has already done. This guide contains no win rates, no historical-test results and no promises about what you will make, because nobody can verify those and you should not trust anyone who prints them. What it hands you instead is a set of rules you can test yourself on TradingView in an afternoon. Educational, not financial advice.
Instant download. 39 pages, PDF.