






CCI Explained — Momentum, Not Overbought
You sold because the Commodity Channel Index pushed above 100 and the books all say that is overbought. Then it stayed above 100 for weeks while price kept climbing without you. So you tried moving the band to 200, and the same thing happened one step later. Somewhere in there you decided the indicator was noise.
It was not noise, and it was not overbought. It has no ceiling to be over. This is a 56-page PDF that teaches CCI from the first thing you see on the screen through to a written strategy with an entry, a stop and an explicit rule for when the trade is wrong.
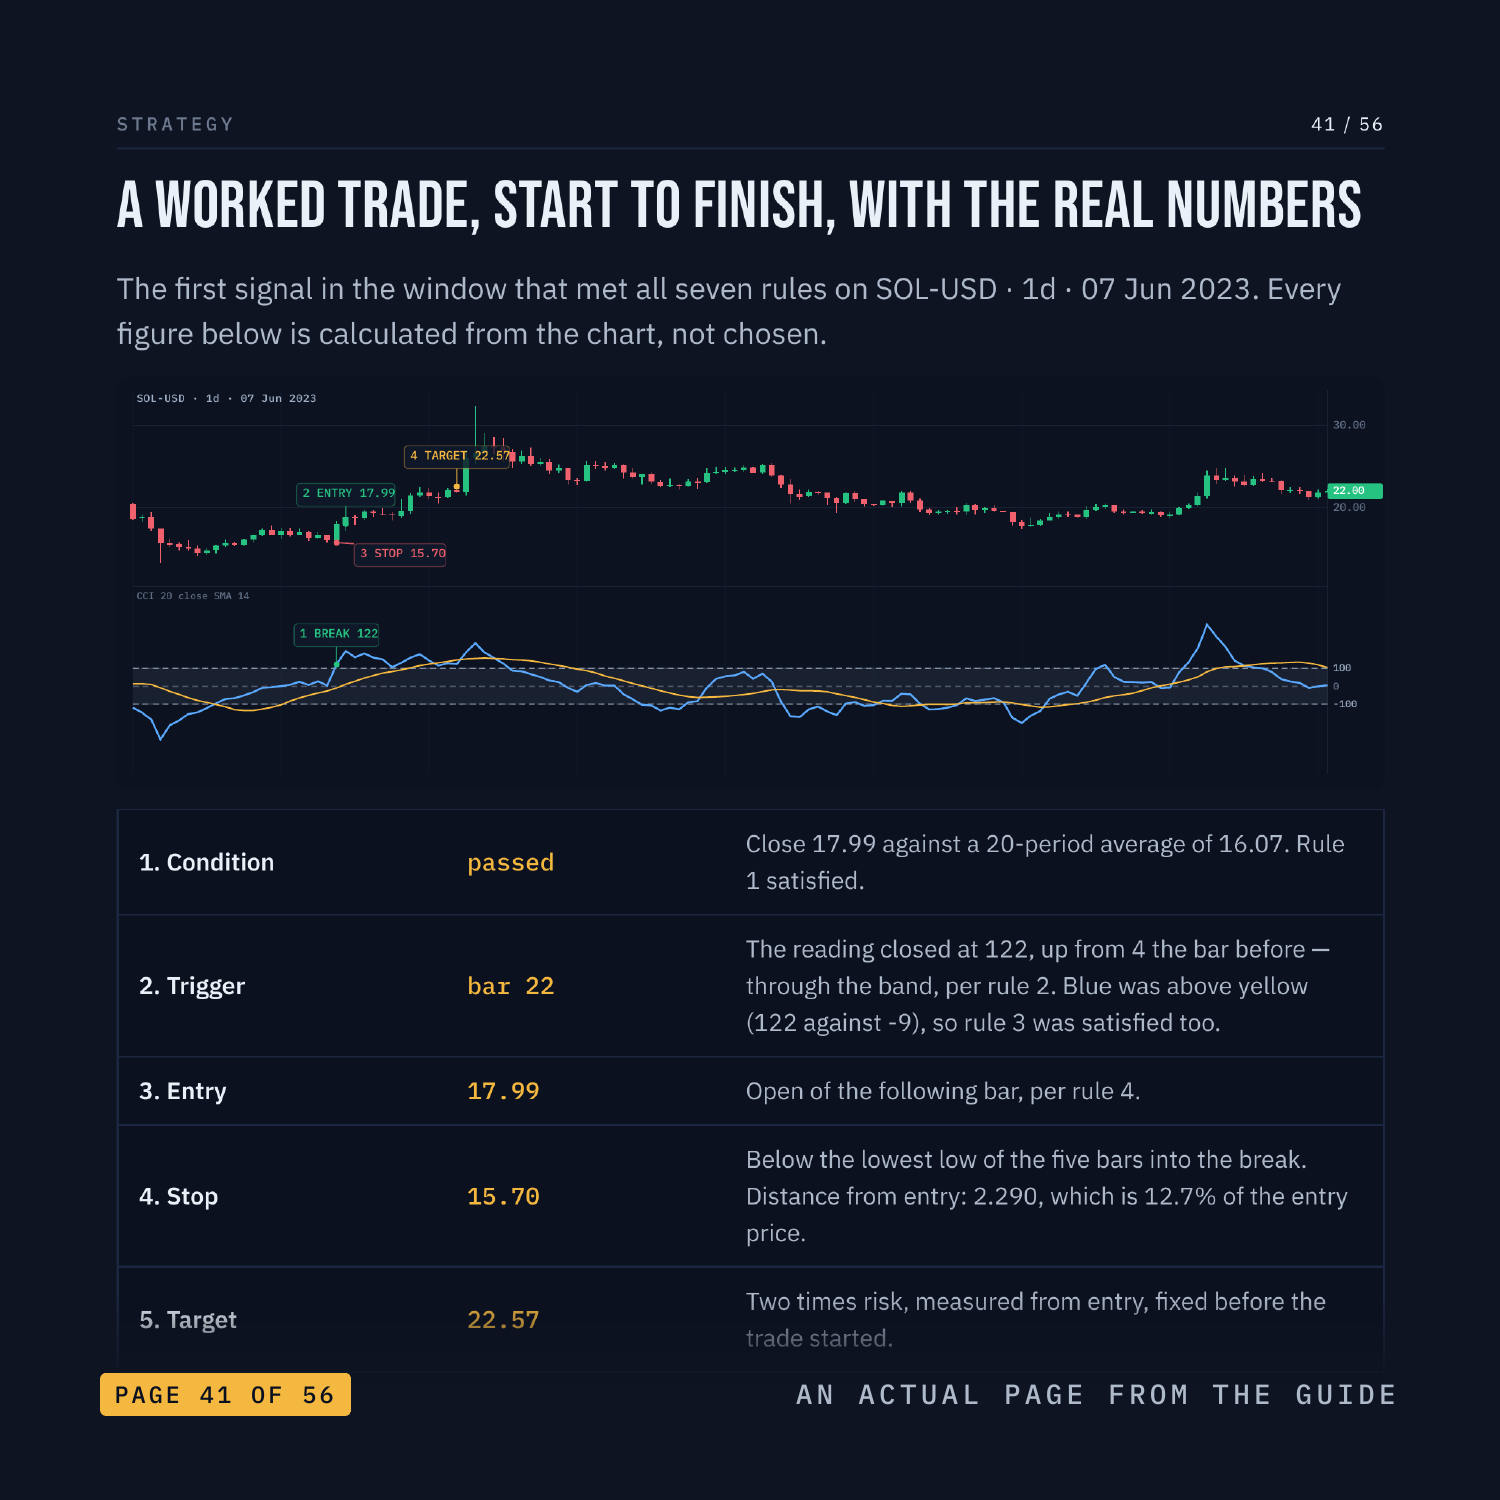
Nothing is taught underneath a chart. Every label sits on the candle, the line or the level it is describing, on real SOL, LTC and ADA charts, with the measured values printed on the panel. There are three quizzes on real charts, each followed by the same chart re-shown annotated with the reasoning, plus faded practice pages where the first steps are filled in and you finish the rest.
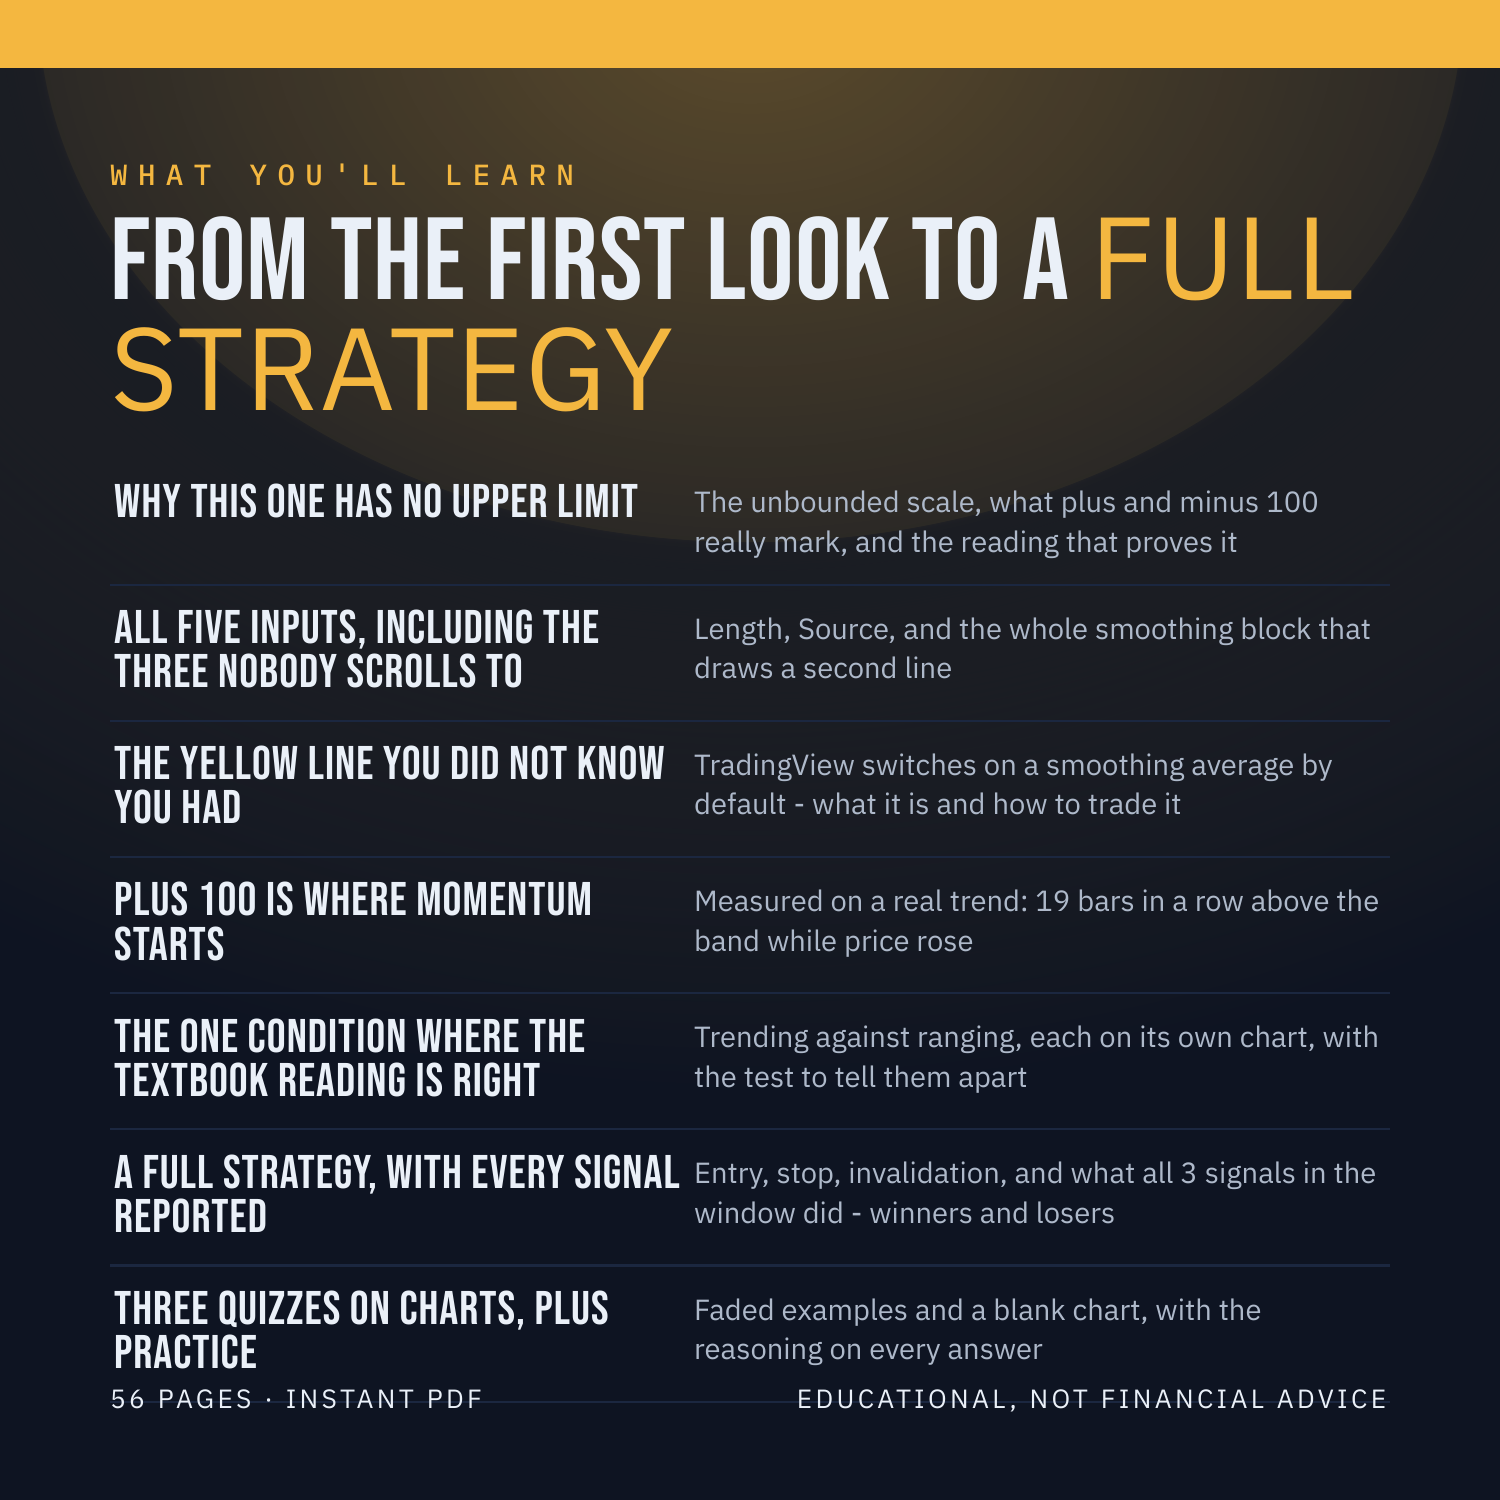
WHAT'S INSIDE
- Why this one has no upper limit — The unbounded scale, what plus and minus 100 really mark, and the reading that proves it
- All five inputs, including the three nobody scrolls to — Length, Source, and the whole smoothing block that draws a second line
- The yellow line you did not know you had — TradingView switches on a smoothing average by default, what it is and how to trade it
- Plus 100 is where momentum starts — Measured on a real trend: 19 bars in a row above the band while price rose
- The one condition where the textbook reading is right — Trending against ranging, each on its own chart, with the test to tell them apart
- A full strategy, with every signal reported — Entry, stop, invalidation, and what all 3 signals in the window did, winners and losers
- Three quizzes on charts, plus practice — Faded examples and a blank chart, with the reasoning on every answer
WHAT YOU'LL BE ABLE TO DO
- Read a panel that has no ceiling without mistaking a threshold for a limit
- Find all five inputs, and say what each one changes
- Identify the yellow smoothing line and trade its crossings
- Tell a trending market from a ranging one before you take a band signal
- Take the break of a band as momentum in a trend, and as exhaustion in a range, and know which you are looking at
AN HONEST NOTE
CCI is a clue, not a crystal ball. It describes what price has already done. This guide contains no win-rates, no backtest results and no promises about what you will make, because nobody can verify those and you should not trust anyone who prints them. What it hands you instead is a set of rules you can test yourself on TradingView in an afternoon. Educational, not financial advice.
Instant download. 56 pages, PDF.