

Help Desk Response Dashboard
Help Desk Response Dashboard
Tickets, response times and resolution performance — measured against the SLA for each priority, not against an average that hides the problem.
Service desks report averages because averages look calm. A mean response time of four hours can hide a critical ticket that sat for three days. This dashboard measures every ticket against the target for its own priority, then shows you the ones that breached.
What's inside
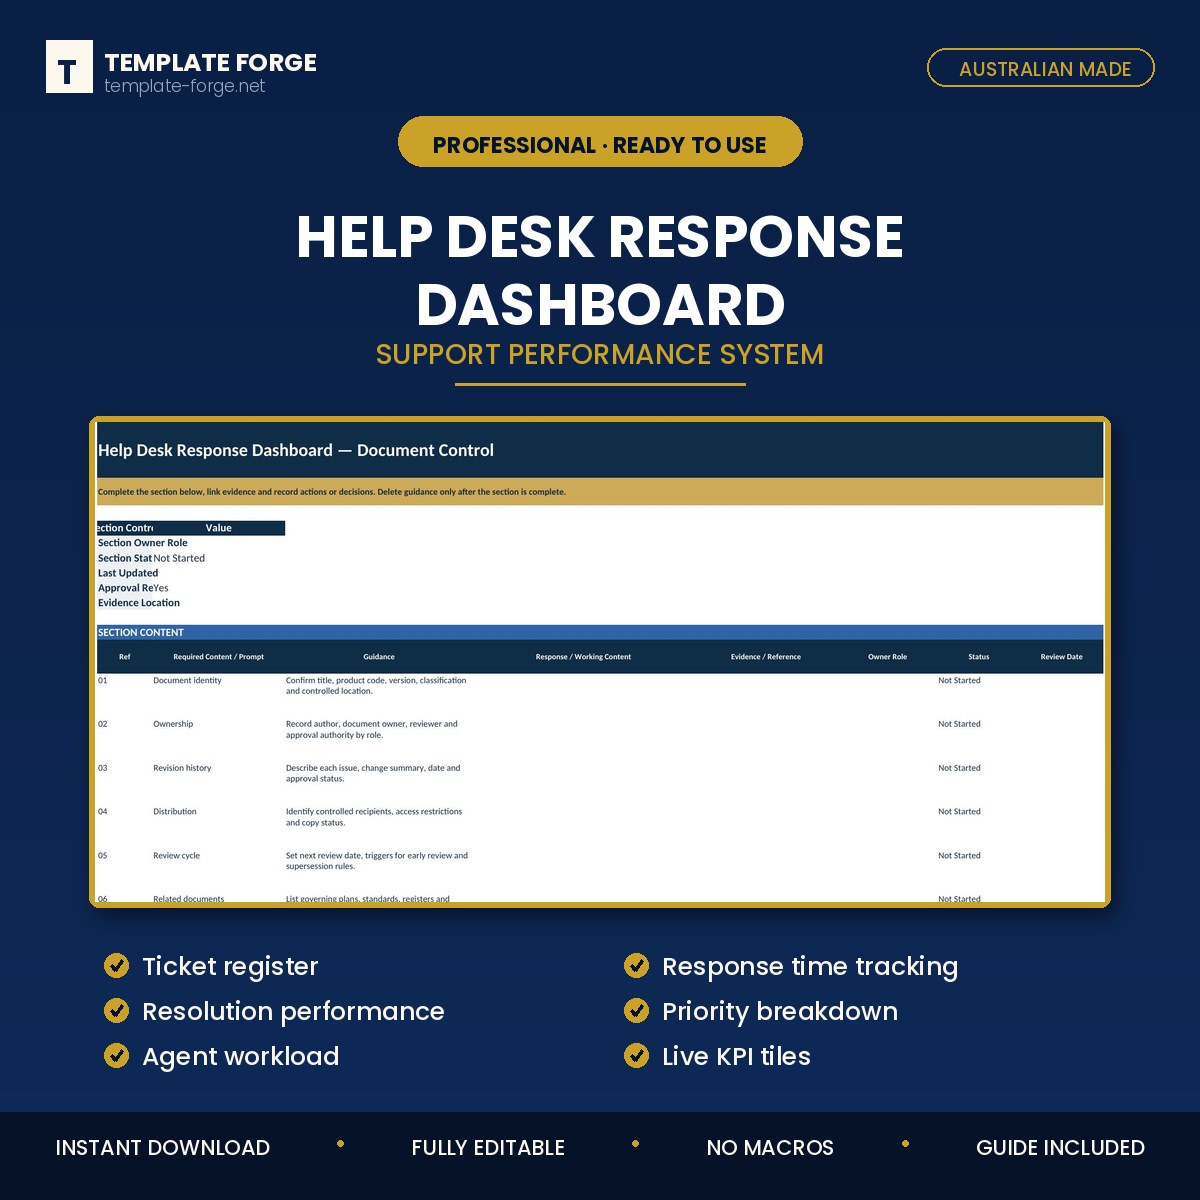
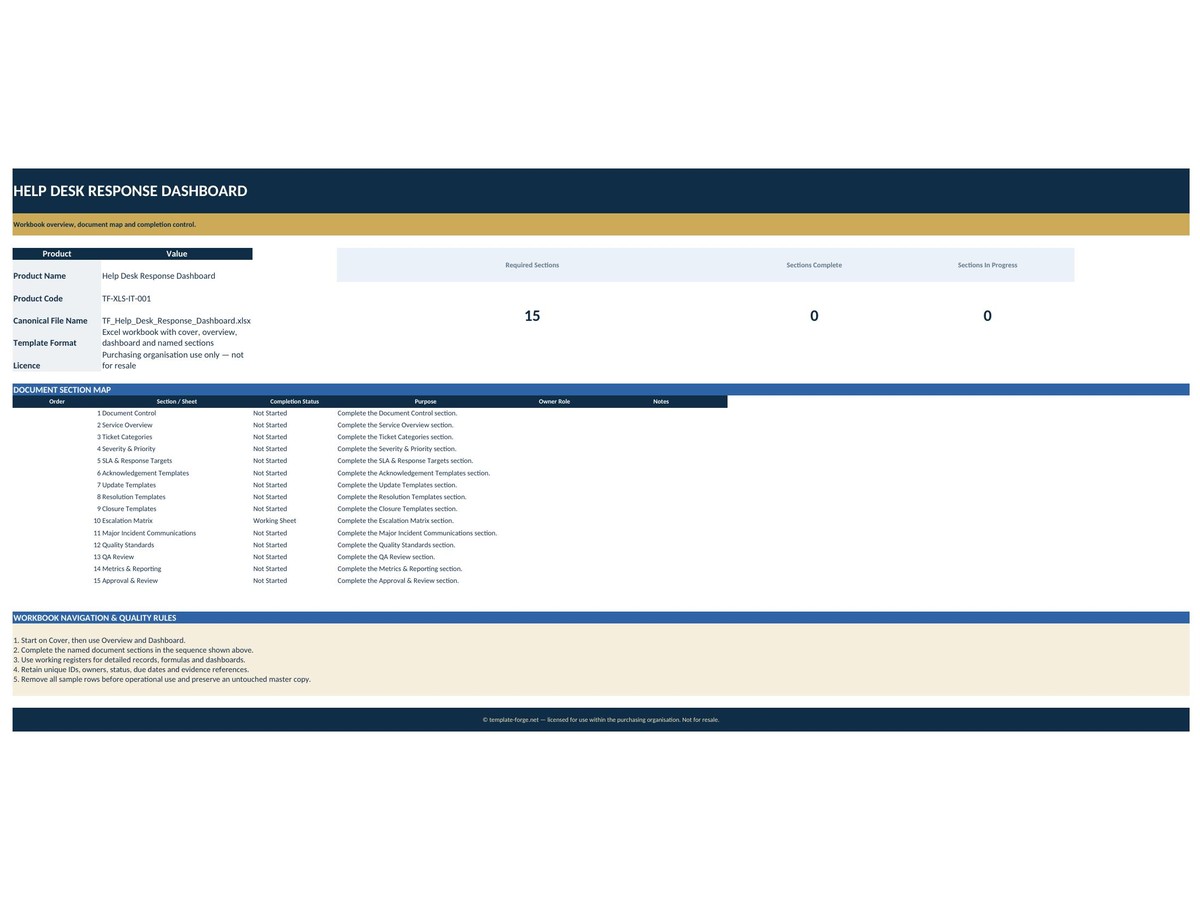
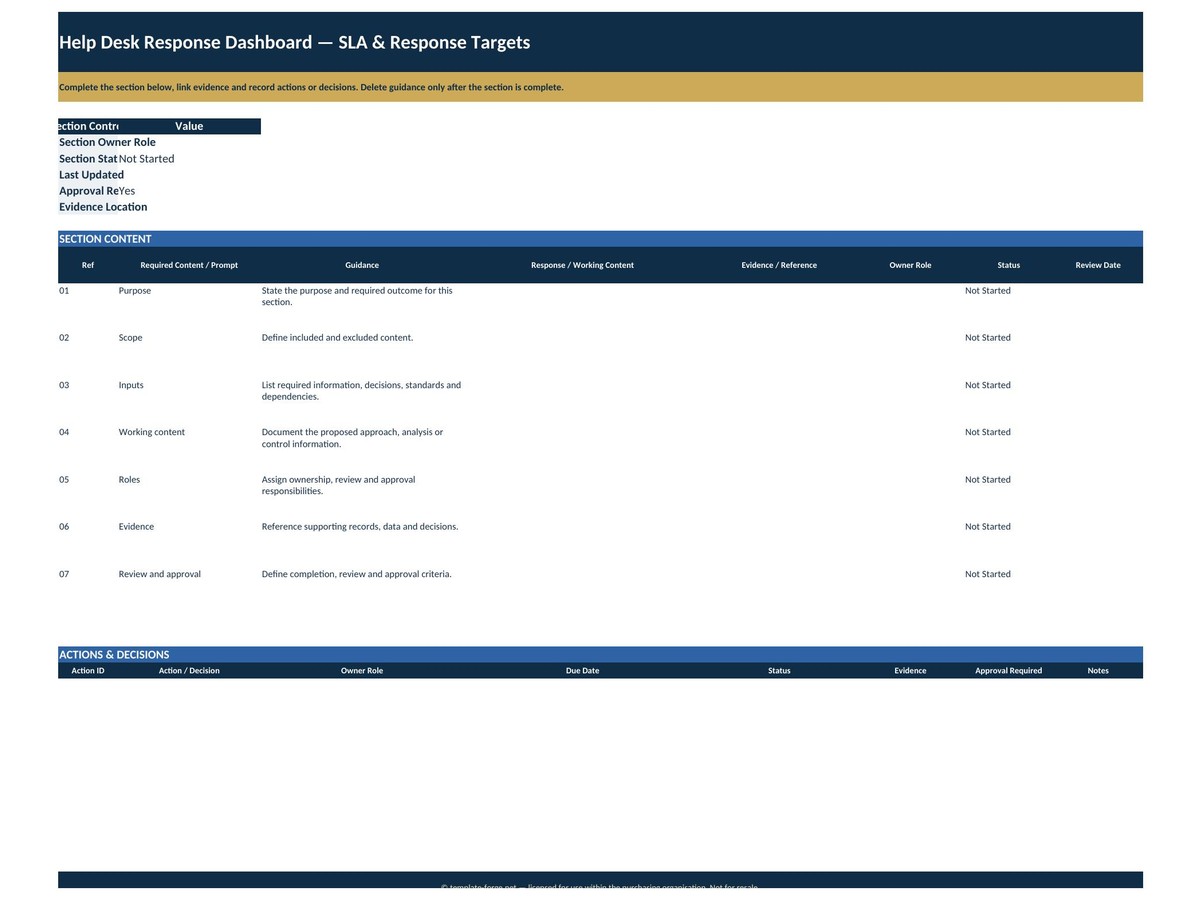
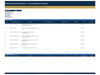
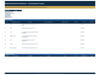
- Ticket register — every ticket with priority, category, channel, owner and status
- SLA tracking — met or breached, judged against the target for that priority
- Response and resolution times — first response and time to close, measured separately
- Ageing — how long open tickets have been sitting, grouped into buckets
- Priority breakdown — where the volume and the pain actually are
- Agent workload — who is carrying what
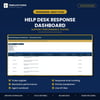
- Live dashboard — service performance on one screen
The number worth watching
Breach rate by priority. A desk can hit 95% overall and be failing every critical ticket, because criticals are rare and averages bury them. This separates them.
Who it's for
Service desk leads, IT managers and small businesses running support out of an inbox who need to show performance rather than describe it.
How it works
Set your SLA targets per priority once on the setup sheet. Log tickets as they arrive and close. Breach flags, ageing buckets and mean time to resolve calculate themselves. No macros, no add-ins, no subscription — a normal Excel file that opens in any version of Excel and keeps working forever.
Pairs with the Customer Service Dashboard if you want satisfaction and complaint tracking alongside the ticket performance.
Built in Australia from more than twenty years of program delivery experience. Instant download, yours to keep, use it across as many teams as you like.