
Rent vs. Buy Calculator: Break-Even Year, Monthly Cost & Net Worth Spreadsheet (Google Sheets + Excel)
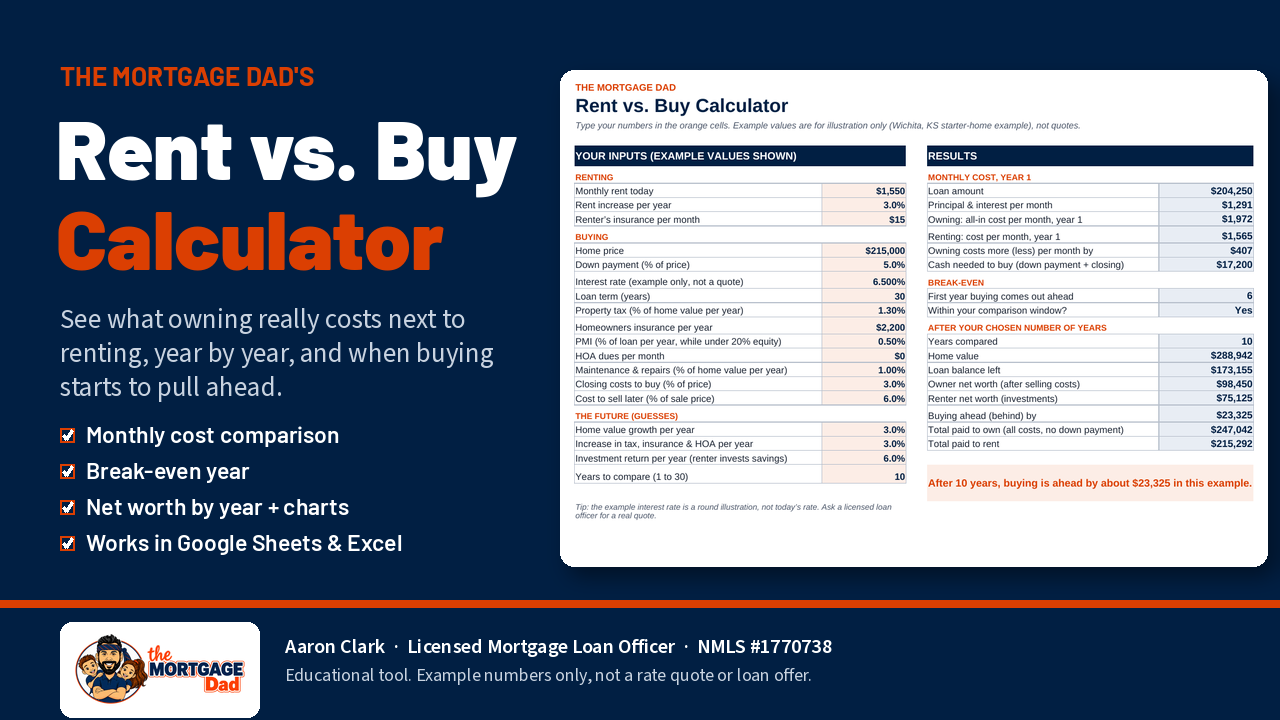
Is buying really cheaper than renting, or does it just feel that way? This spreadsheet lays both paths side by side so you can see the real numbers for your situation.
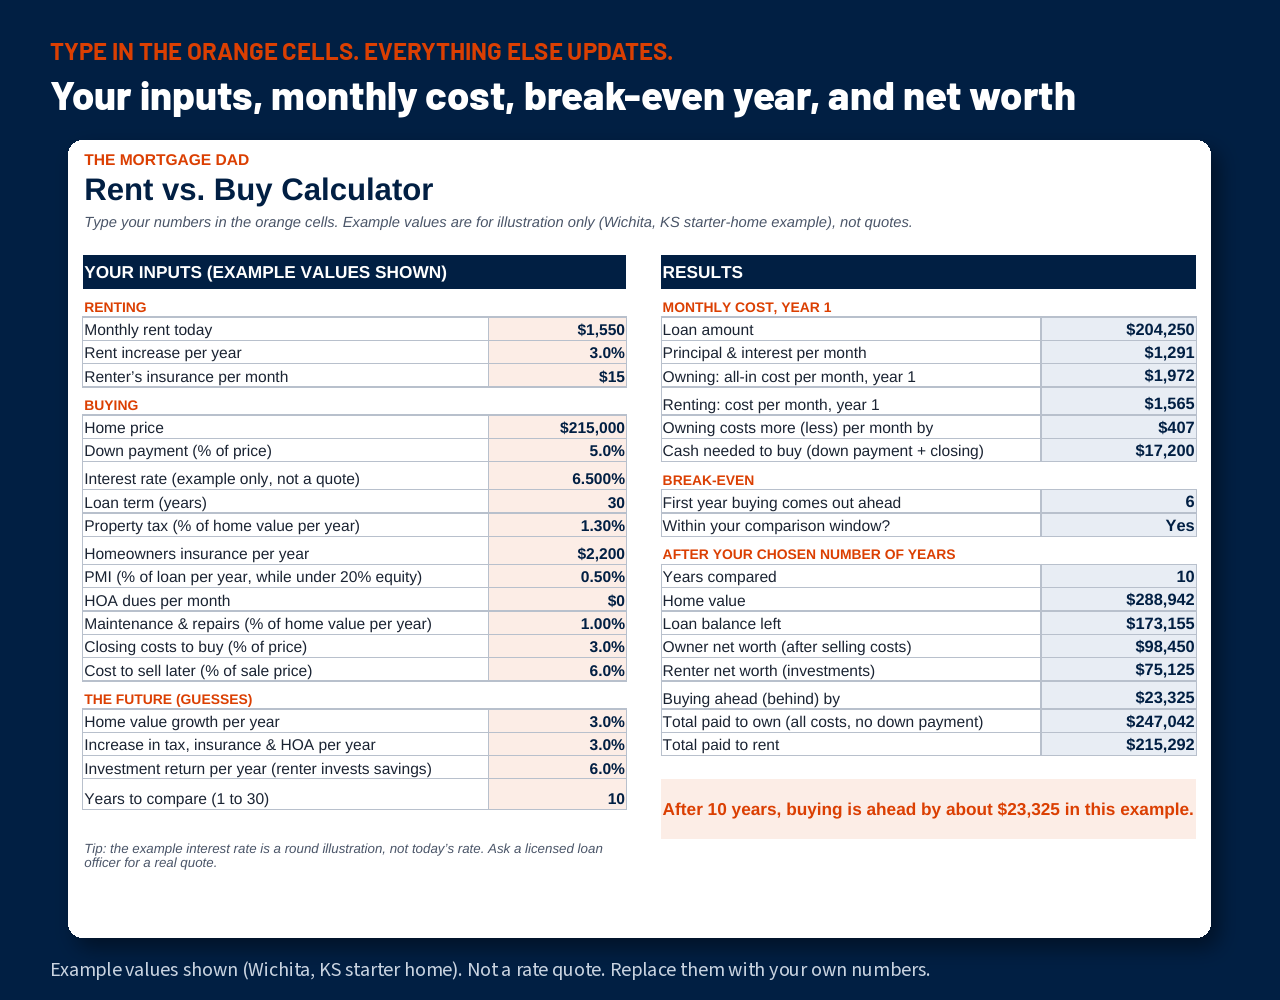
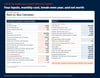
Type your numbers into the orange cells: rent and rent increases, home price, down payment, interest rate, loan term, property tax, insurance, PMI, HOA, maintenance, closing and selling costs, home value growth, investment return, and how many years you plan to stay. Everything else updates on its own.
What it shows you
- Your all-in monthly cost to own next to your monthly cost to rent
- The first year buying comes out ahead (your break-even year)
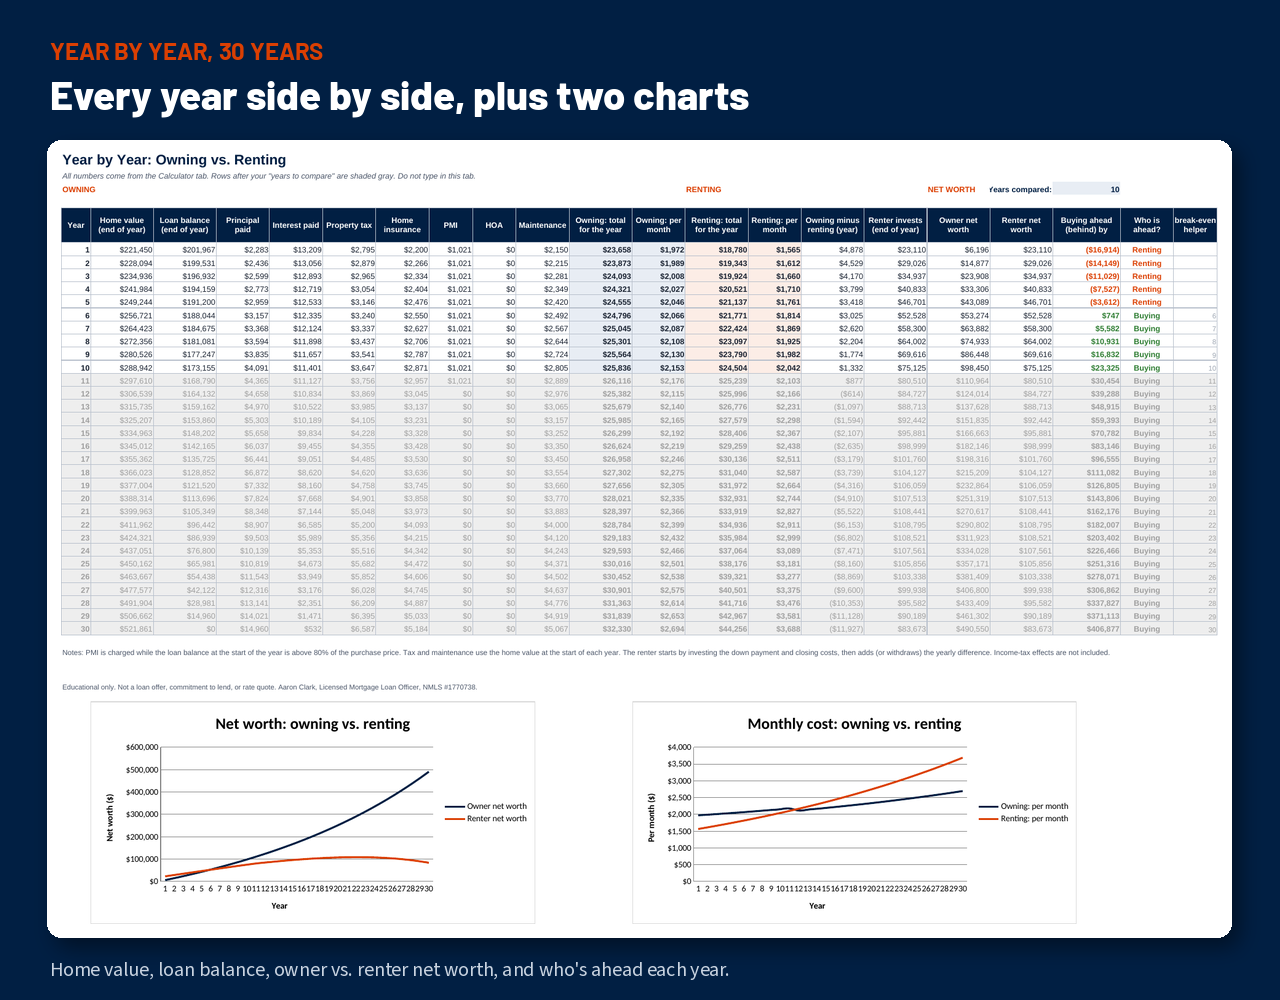
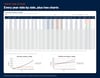
- Owner net worth vs. renter net worth for every year, out to 30 years
- Charts for net worth and monthly cost over time
The renter side is fair: it assumes the renter invests the down payment, closing costs and any monthly savings, so you're comparing two real plans, not rent vs. nothing.
Good to know
- Instant download, one .xlsx file. Works in Google Sheets (upload, then File > Save as Google Sheets), Excel and LibreOffice.
- Comes filled in with example numbers for a Wichita, Kansas starter home. They're illustrations only, not current rates or prices.
- Educational tool only. It is not a loan offer, rate quote, or financial advice. Talk with a licensed loan officer and a tax pro about your situation.
Aaron Clark, Licensed Mortgage Loan Officer, NMLS #1770738 · www.nmlsconsumeraccess.org · Equal Housing Opportunity