

Vending Machine Tracker Spreadsheet | Per-Machine Profit Ranking, Restock Log and Location Profit - Google Sheets
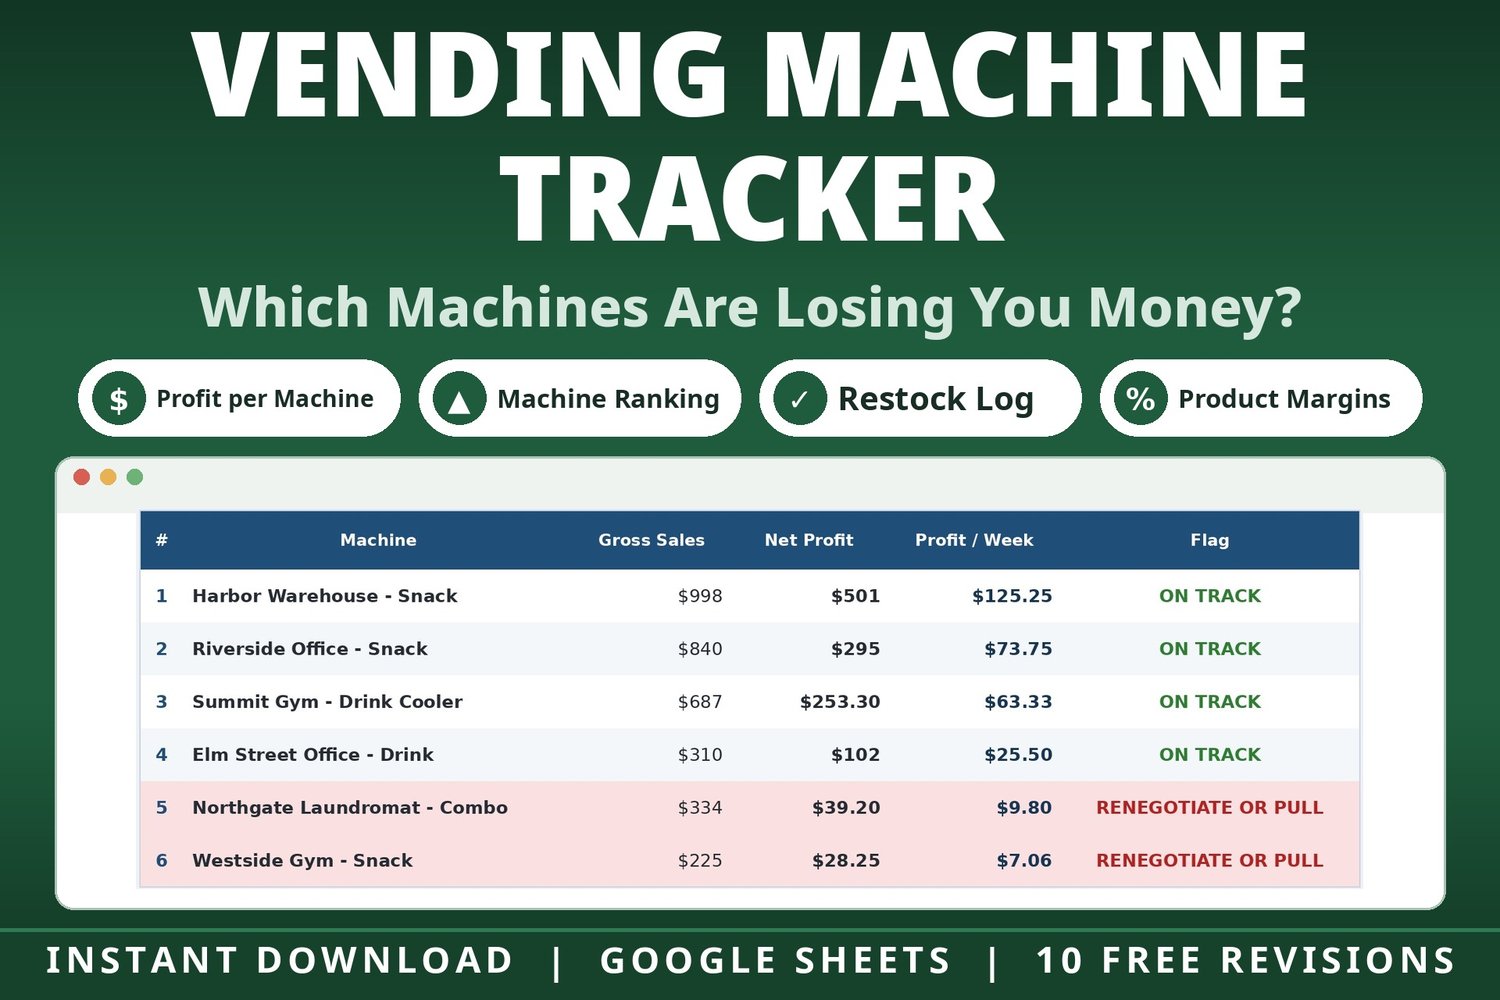
Which machines are quietly losing you money?
Every vending operator has them: machines that get restocked, collected, and serviced like clockwork — and still barely earn their floor space. The problem is never effort. It's that nobody adds up what each machine actually makes after product cost, the location's commission, and the drive out there.
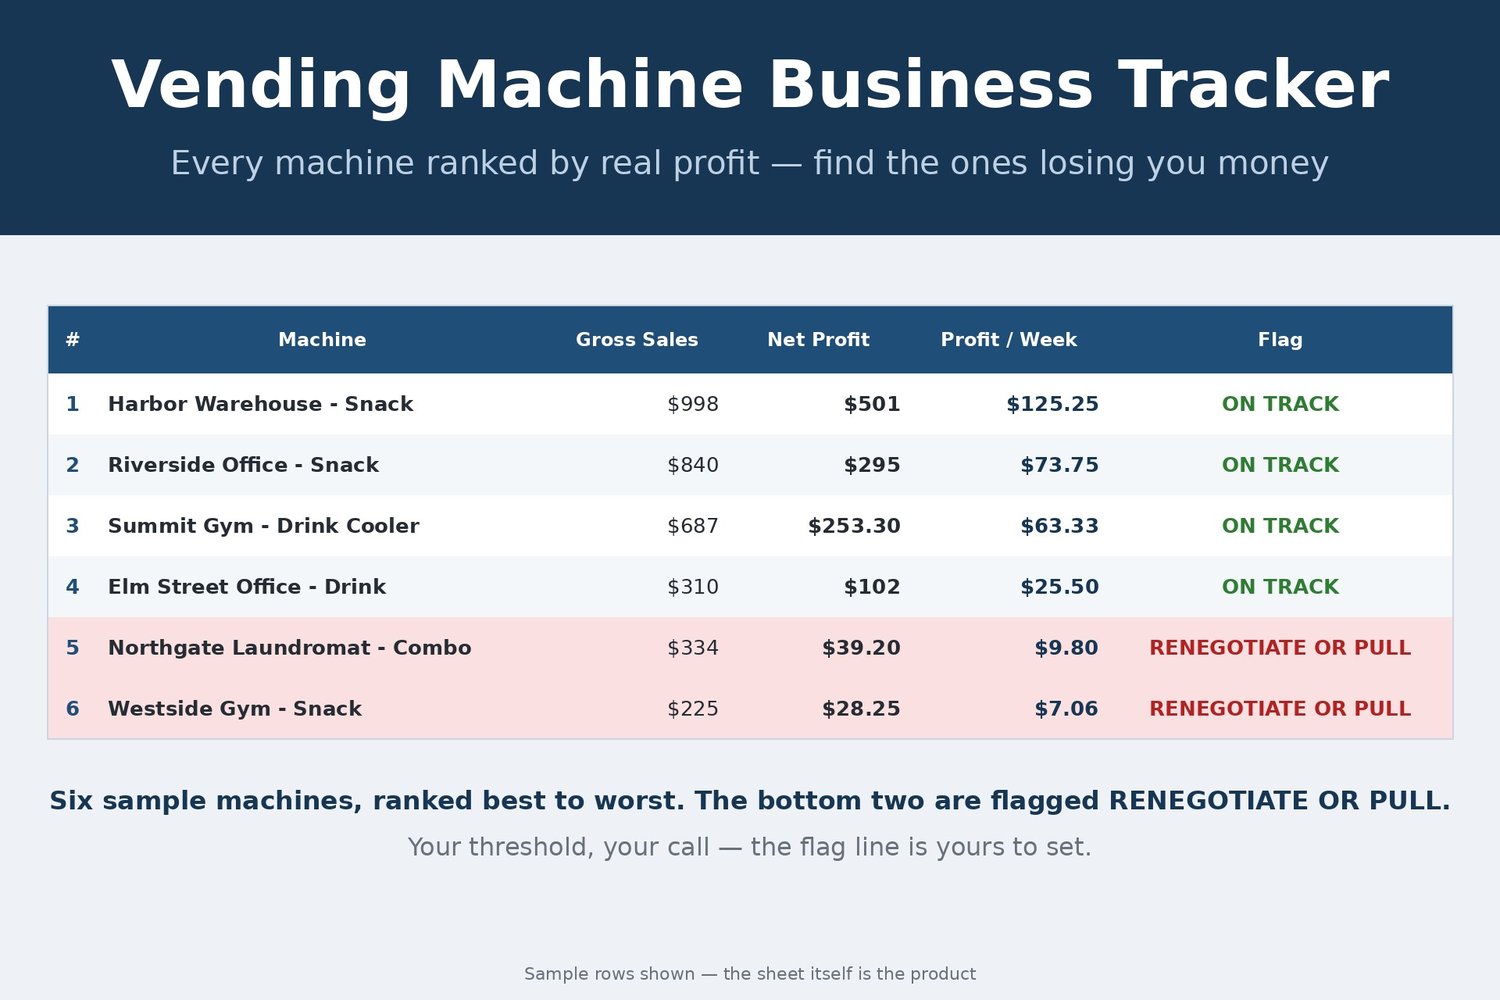
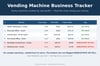
This tracker does that math for you, machine by machine. Log each collection in one row, and the Dashboard ranks every machine by real profit per week — best to worst — and flags the ones falling under your line as RENEGOTIATE OR PULL, so the placement decision makes itself.
Transparency note: this spreadsheet was designed with AI assistance, then hand-built and formula-tested by our shop.
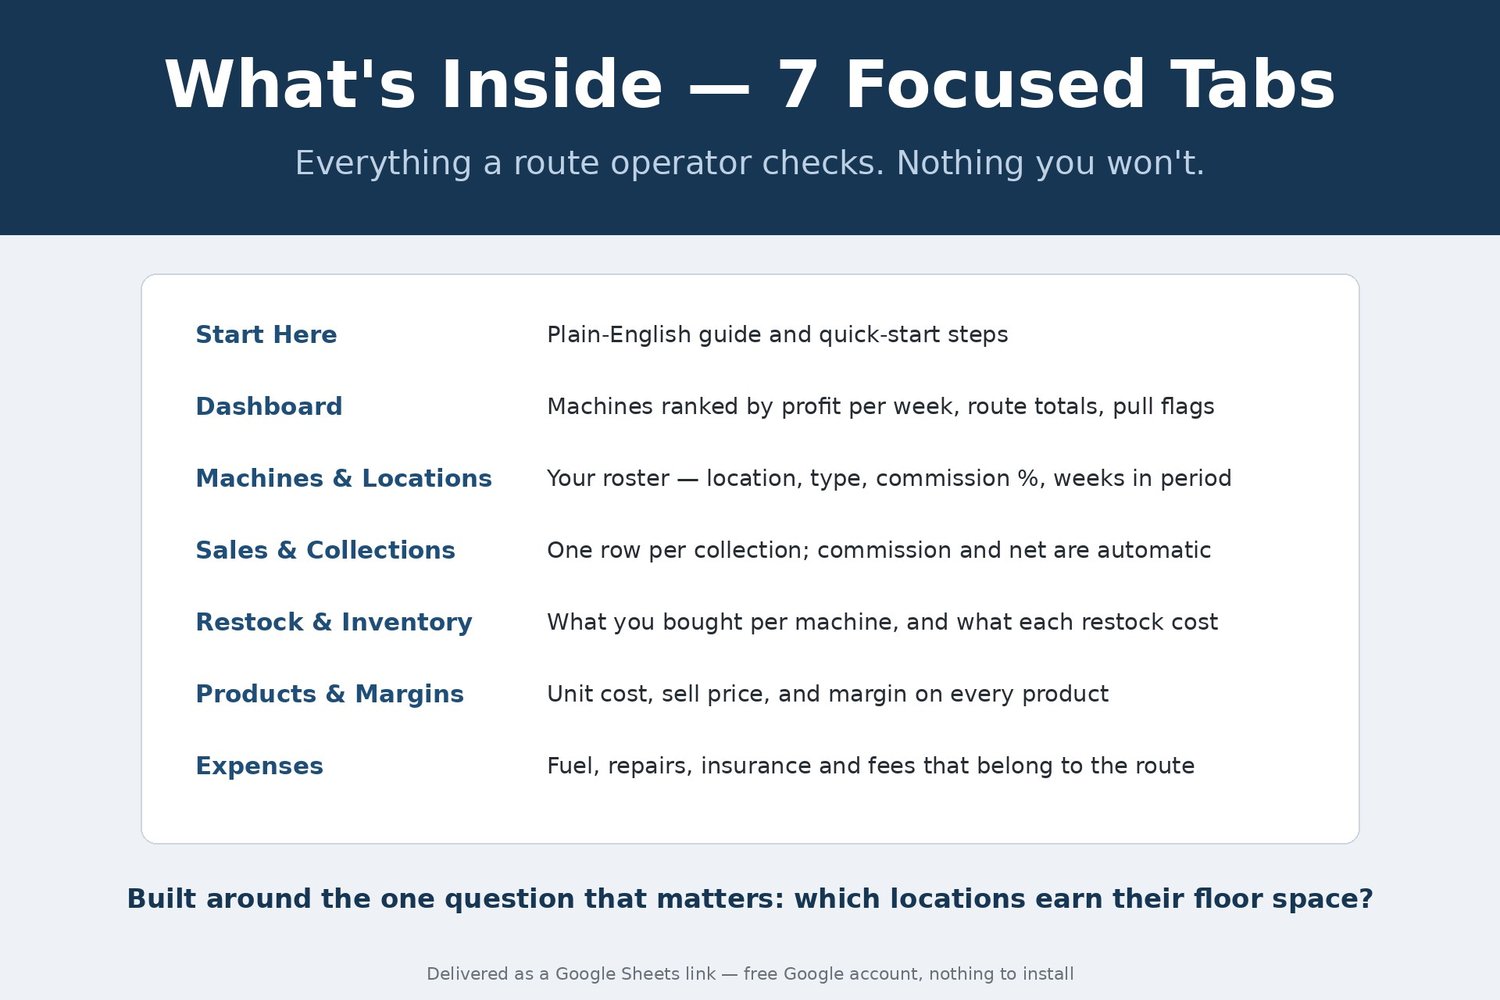
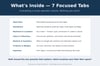
WHAT'S INSIDE — 7 focused tabs:
- Start Here — a plain-English guide and quick-start steps
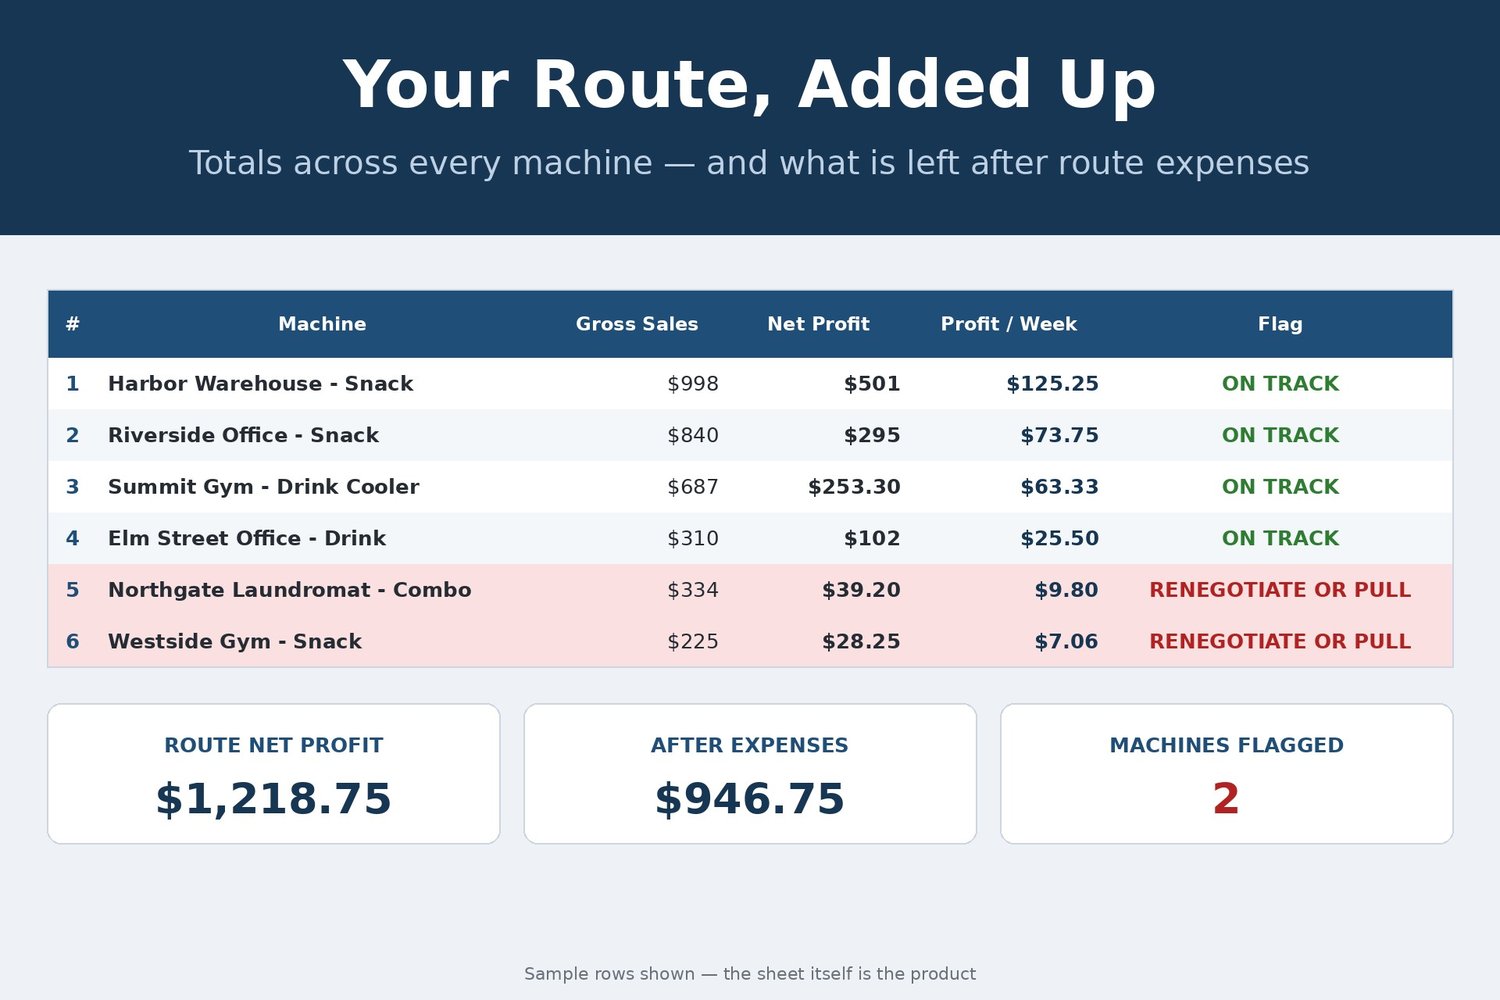
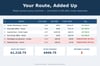
- Dashboard — the ranking: every machine sorted by profit per week, route totals, business expenses, your net after expenses, and a flag count
- Machines & Locations — your roster: machine, location, type, the commission % you pay the location, weeks in period — with live totals per machine
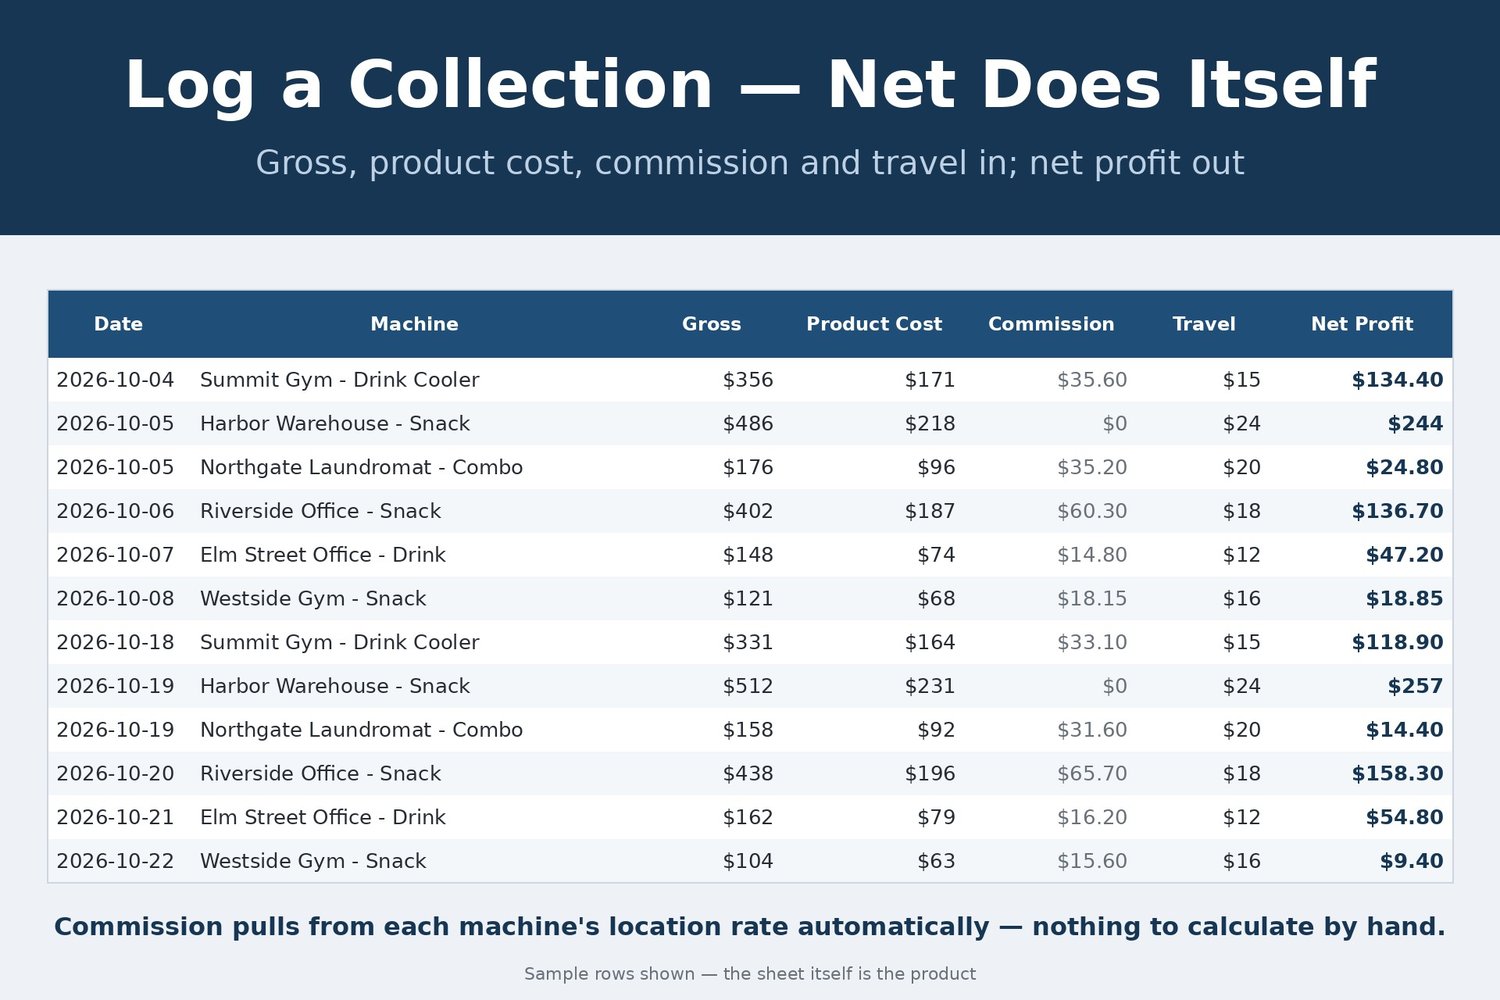
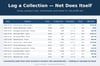
- Sales & Collections — one row per collection: gross sales, product cost, service/travel cost. The location commission and net profit fill themselves in
- Restock & Inventory — what you bought for each machine and what each restock run cost, line by line
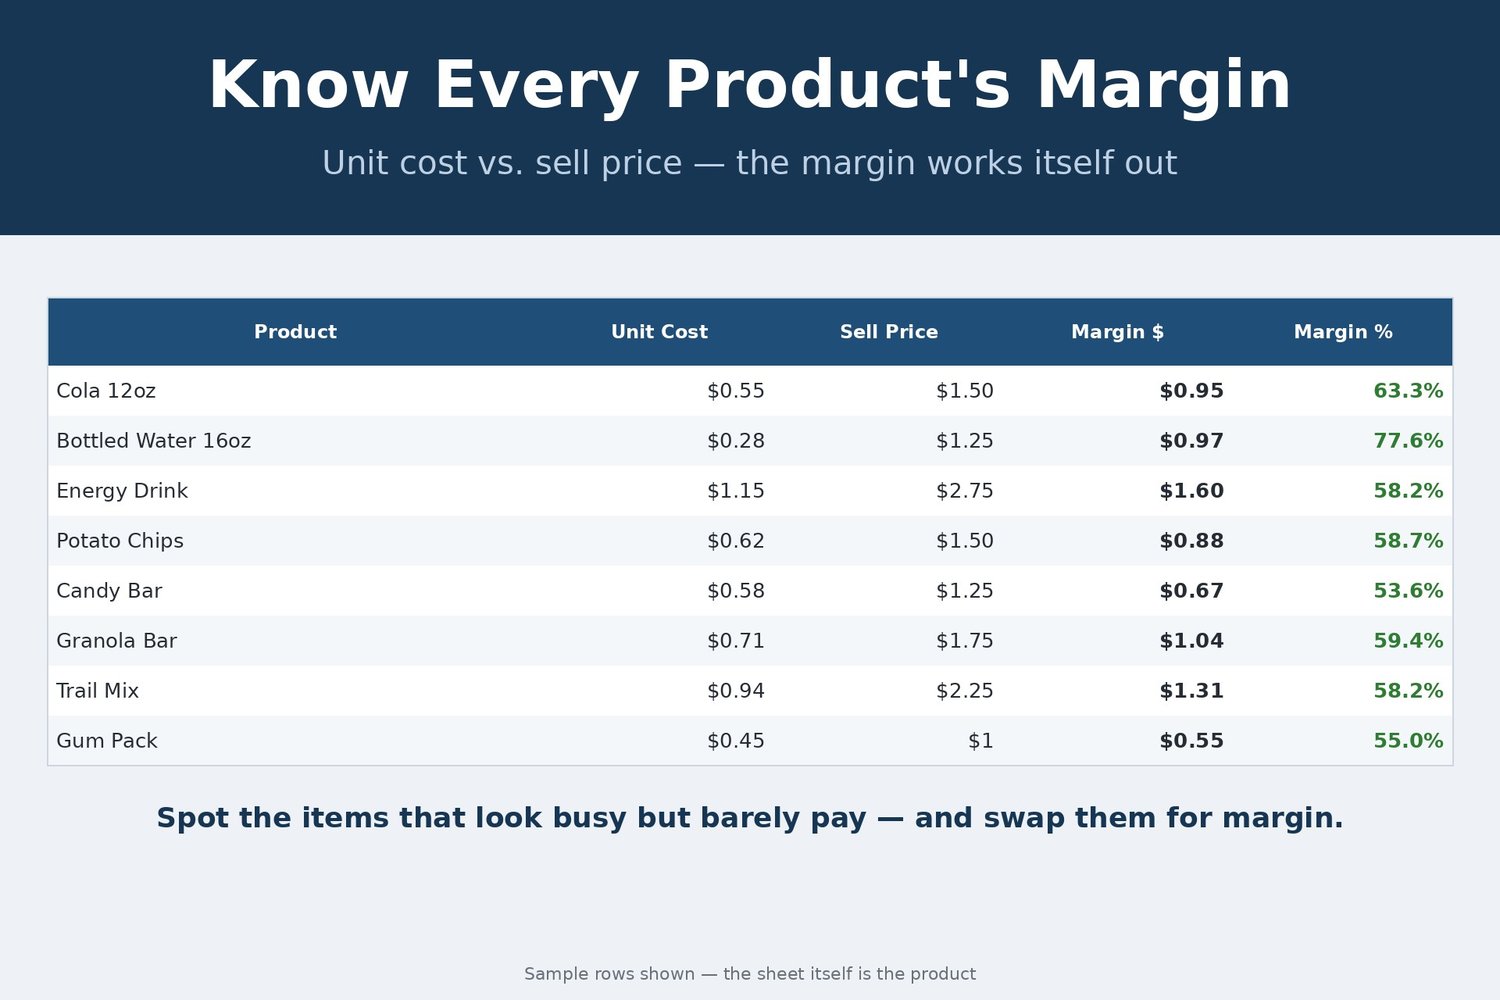
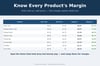
- Products & Margins — your product list with unit cost, sell price, and margin per item, calculated for you
- Expenses — the route-level costs that belong to no single machine: fuel, repairs, insurance, card reader fees
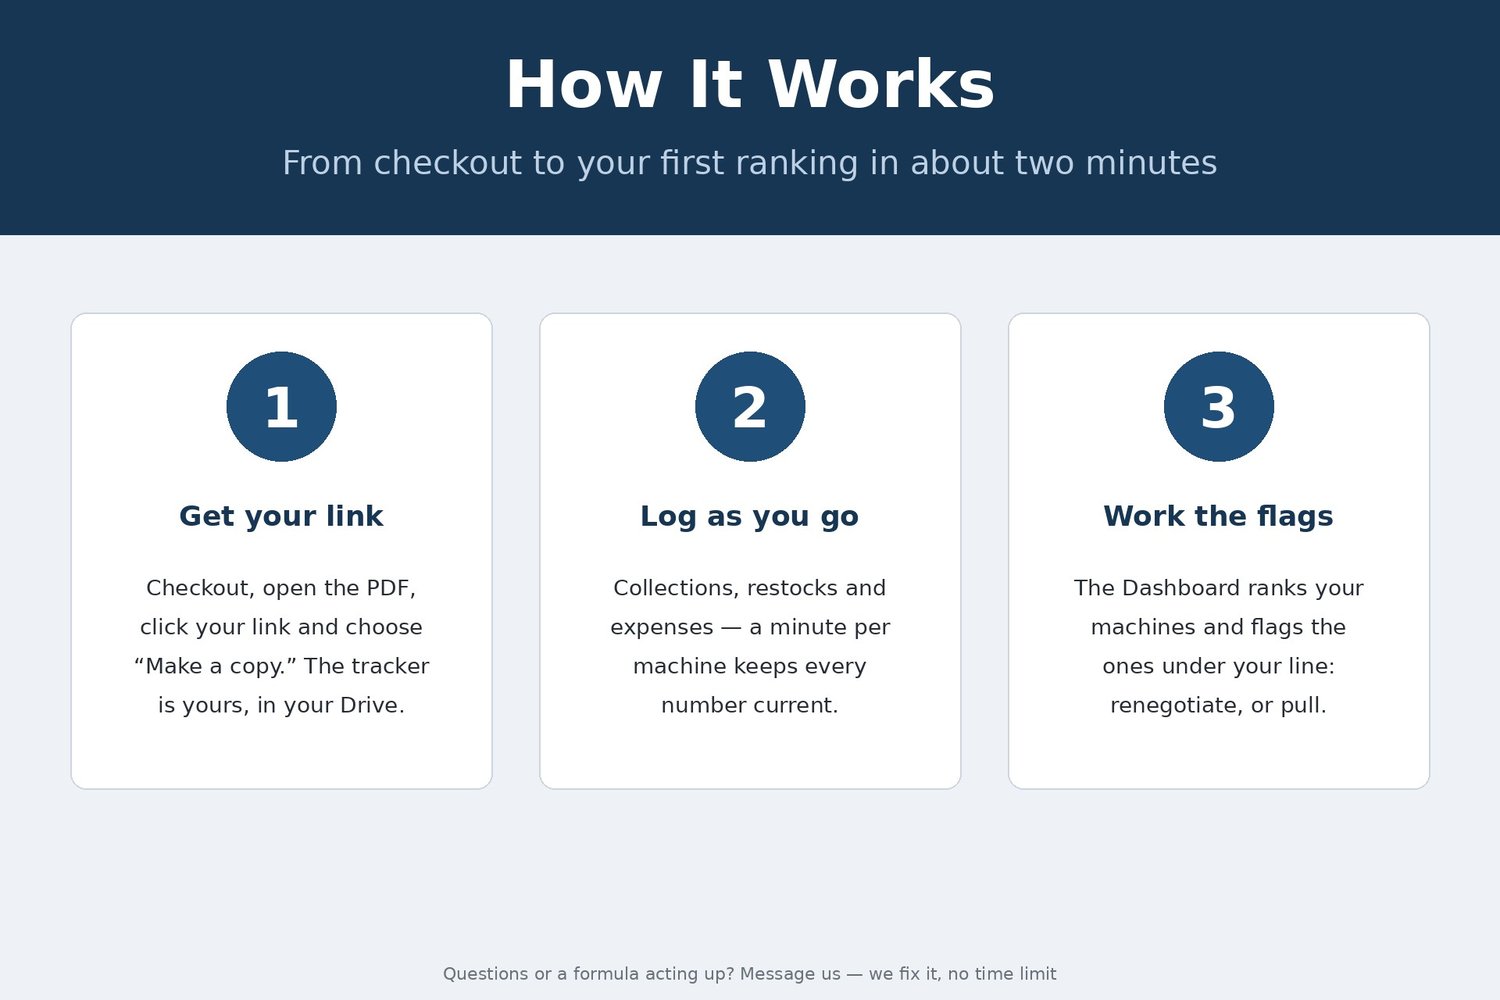
HOW IT WORKS
1. After checkout you get a PDF with your private link. Click it and choose "Make a copy" — the tracker is yours.
2. List your machines and what each location takes in commission. Log each collection as it happens — a minute per machine.
3. Read the Dashboard. Every machine ranked by profit per week, and the dead spots flagged before they cost you another month.
THE FLAG RULE, IN PLAIN ENGLISH
Profit per week = a machine's net profit (gross sales − product cost − location commission − service/travel) divided by the weeks in your period. Any machine under $25 profit per week gets flagged RENEGOTIATE OR PULL. That $25 is a starting line, not our opinion — it lives in one cell on the Dashboard, and changing it updates every flag. A flag isn't a verdict; it's the start of a conversation: renegotiate the commission, swap the product mix, raise a price — or pull the machine and place it where it earns.
WHY THIS ONE
Most vending spreadsheets track inventory or sales. Operators don't lose money on tracking — they lose it on placements. This one leads with the placement decision: which locations earn their floor space, and which ones you're subsidizing. It comes loaded with six fictional sample machines (offices, gyms, a laundromat, a warehouse) so you can watch the ranking and the flags work before you replace them with your own route.
FINISHED FILE — This listing is a digital item, delivered instantly as a file at checkout. The file is finished and ready to use — nothing is customized or personalized. If anything ever breaks or a formula misbehaves, message us and you will receive a corrected file free — forever, no time limit.
REQUIREMENTS: a free Google account. Your tracker lives in Google Sheets — no Excel needed, and it works at the warehouse, on the route, and on your phone.
This is a digital product — no physical item will be shipped, and all sales are final (we can't accept returns or cancellations on digital downloads). Your files are available instantly after checkout. But don't worry: if anything isn't working right, message us anytime and we'll fix it for you — no time limit.