
Soft JavaFX - Diagrame
The program allows:
- The representation of data in diagrams such as: Pie Chart, Line Chart, Area Chart, Bubble Chart, Scatter Chart and Bar Chart.
Data is entered using the keyboard in text fields whose number is variable, depending on the user's desire.
Charts are generated by operating the necessary corresponding buttons.
Functioning
- It requires the input of a value (integer) into the text "GIVE an integer between 1 and 6". If the specified amount is missing, or the value does not fall within the range stated or is introduced a character or string, the background color of the text field changes from yellow to red.
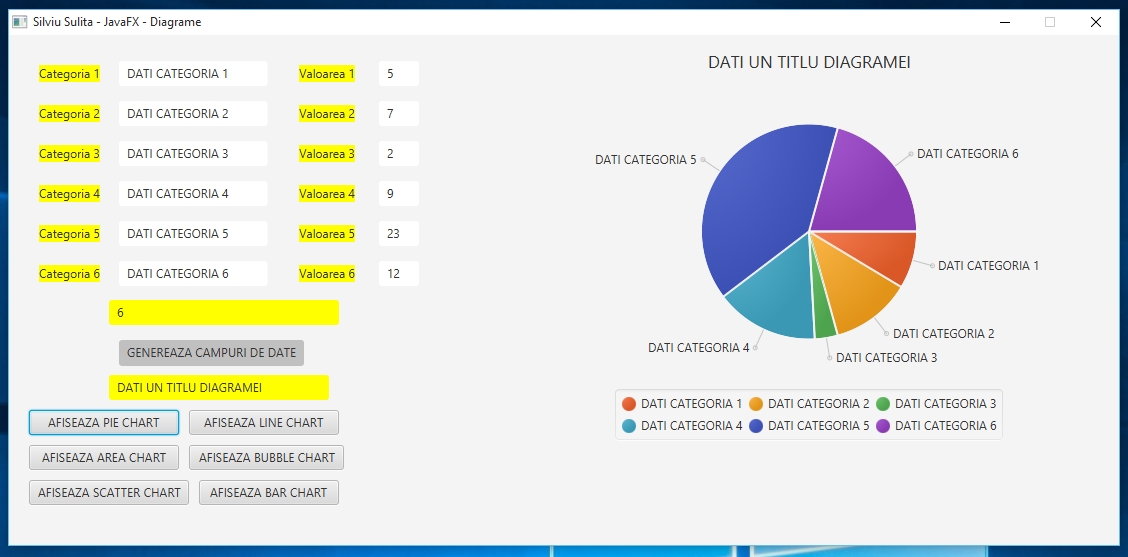
- Pressing the button "Generate data fields" leads to display a vector "Categories" and a vector "Values".
- It requires entering numerical values (real numbers) in text fields generated. If one of those required values misses or it is entered a character or a string: the background color of the variable text field to be inserted is changed from yellow to red and the message "GIVE A NUMBER" or "No. ?“ appears.
- It requires the input of a value string in the text field "Give a title to the chart."
- Pushbutton "PIE CHART SHOW” leads to display a “PIE CHART”.
- Pushbutton "LINE CHART SHOW” leads to display a “LINE CHART”.
- Pushbutton "AREA CHART SHOW” leads to display a “AREA CHART”.
- Pushbutton "BUBBLE CHART SHOW” leads to display a “BUBBLE CHART”.
- Pushbutton "SCATTER CHART SHOW” leads to display a “SCATTER CHART”.
- Pushbutton "BAR CHART SHOW” leads to display a “BAR CHART”.