




Triangles Explained — Measured (PDF Guide)
You were taught three triangles - ascending, descending, symmetrical - and a direction for each one. Then you went looking and found them constantly, in every timeframe, pointing every way. The reason is not that you are bad at drawing trendlines. It is that the one published definition of a triangle describes only one of those three shapes, attaches no direction to it at all, and rests entirely on a smoothing choice nobody ever mentioned to you.
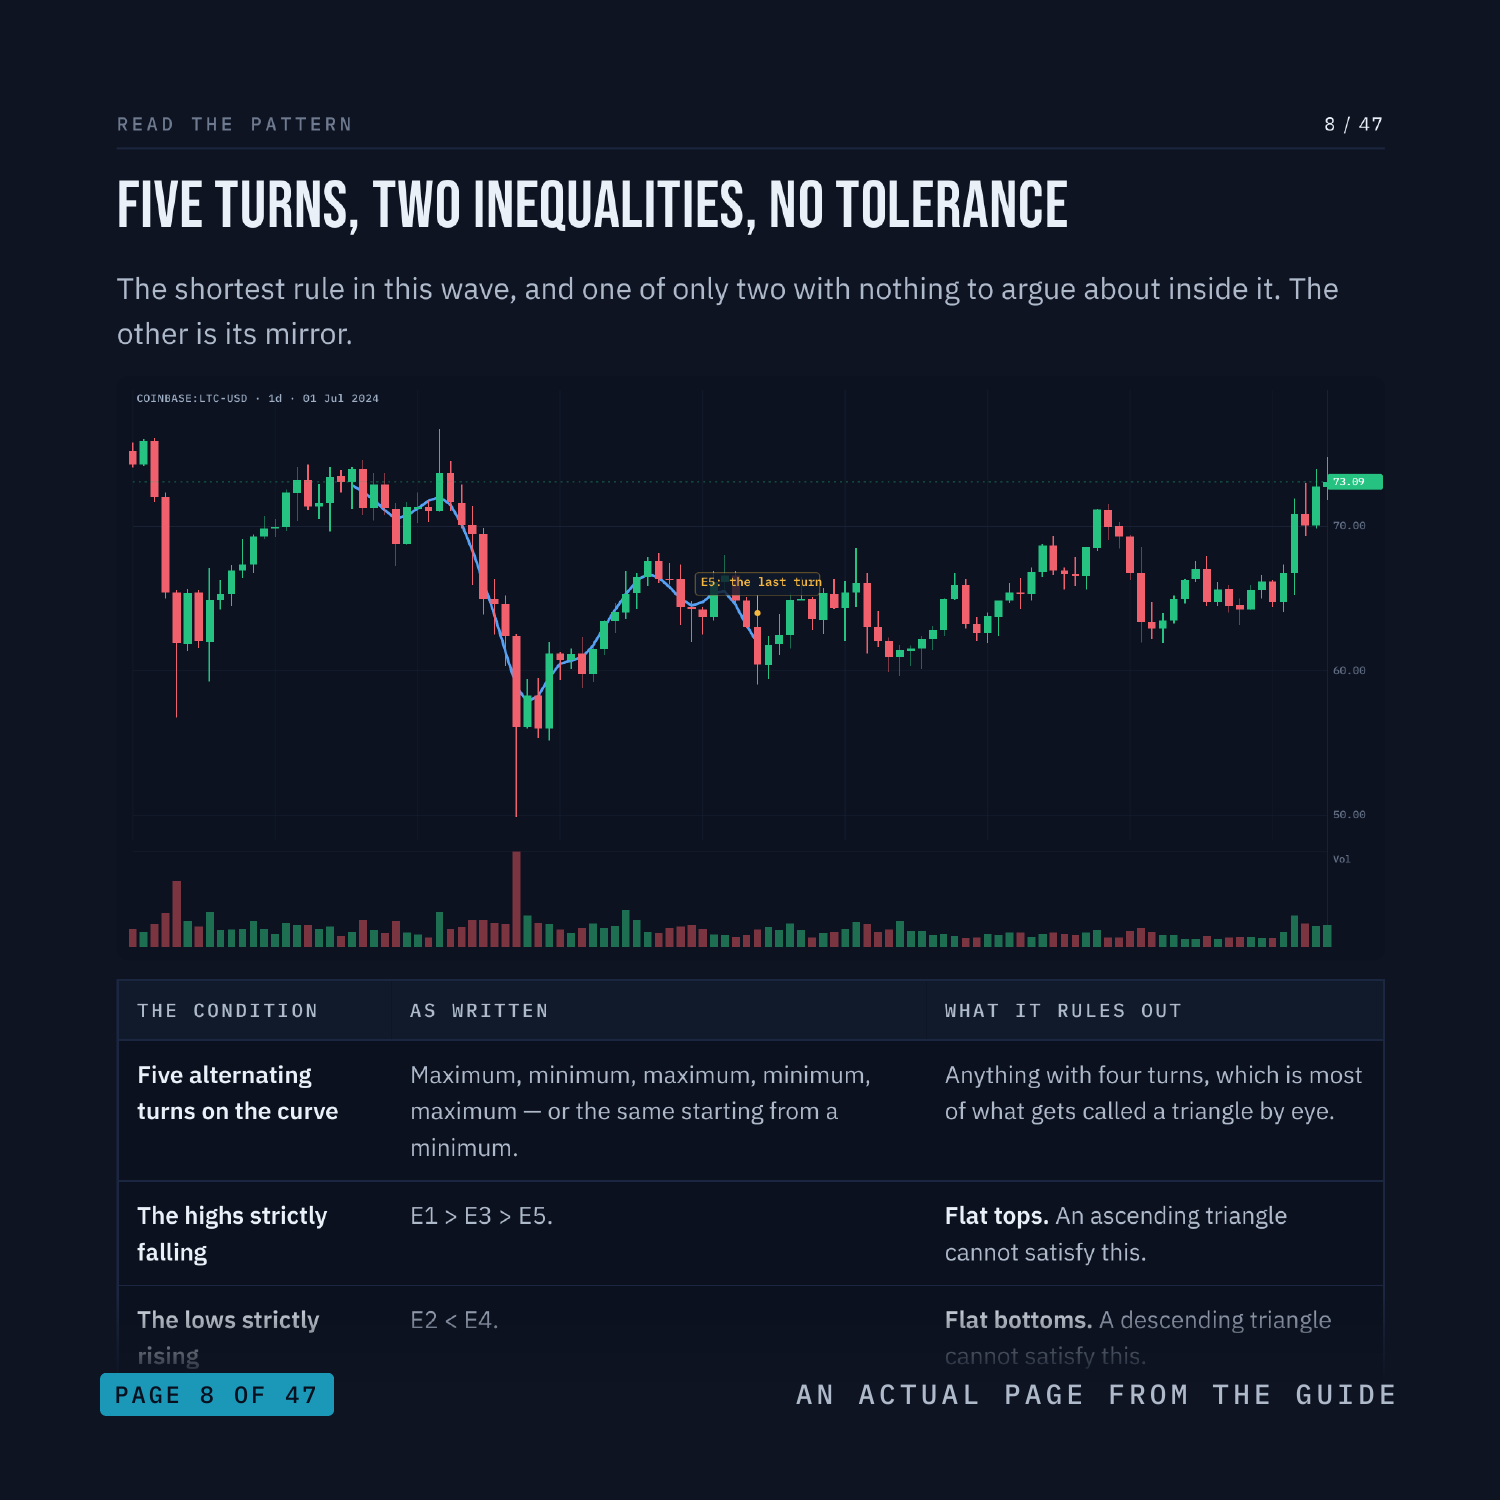
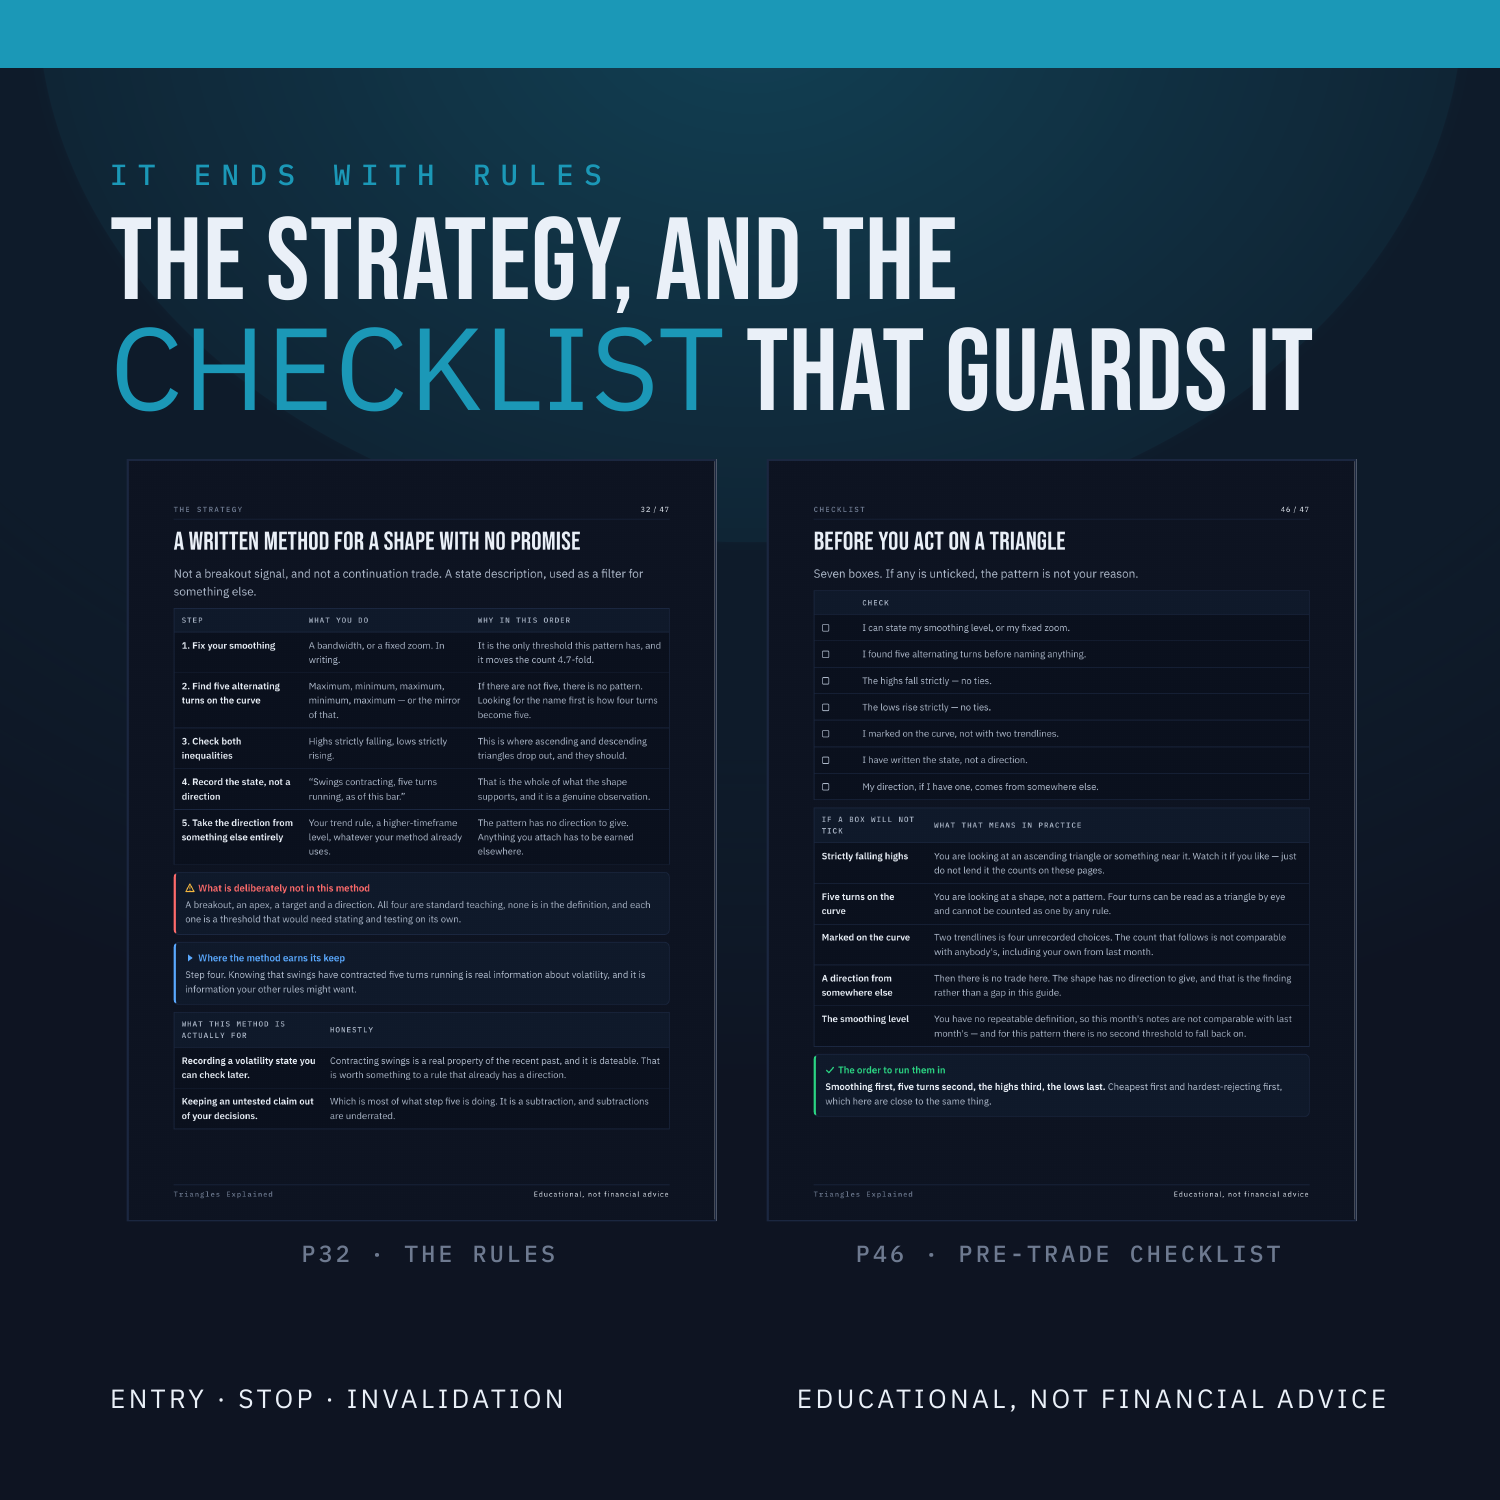
This guide uses the published algorithmic definition - Lo, Mamaysky and Wang, Journal of Finance 2000 - printed as written: five turning points, strictly falling maxima and strictly rising minima. Across 35,944 bars that gives 156 triangle tops and 147 triangle bottoms. Then it says exactly what can and cannot be claimed from that, which is less than you have been told and more solid. This is a 47-page PDF that teaches Triangles from the first thing you see on the screen through to a written strategy with an entry, a stop and an explicit rule for when the trade is wrong.
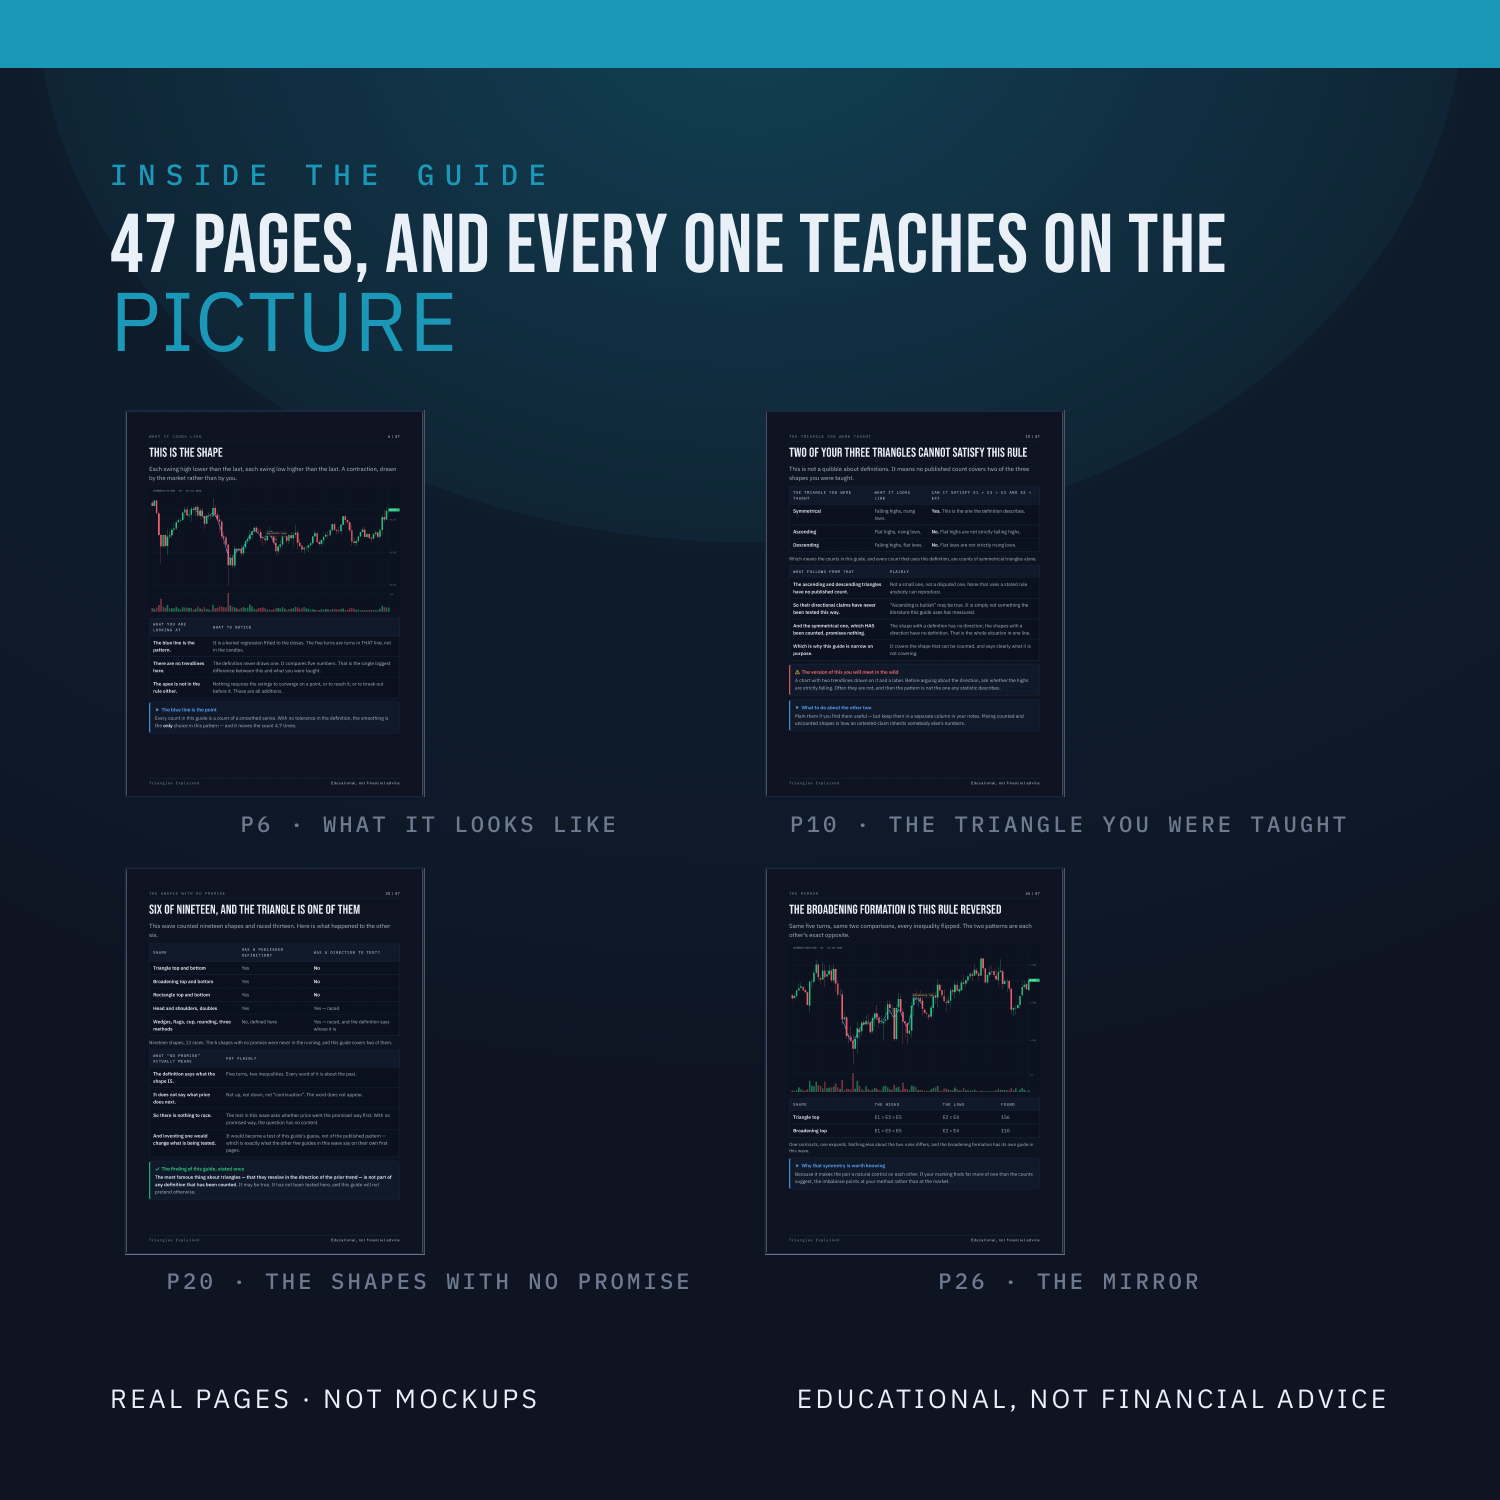
Nothing is taught underneath a chart. Every label sits on the candle, the line or the level it is describing, on real BTC, ETH, SOL and LINK charts, with the smoothed curve the detector actually saw drawn over the candles. There are three quizzes on real charts, each followed by the same chart re-shown annotated with the reasoning, plus faded practice pages where the first steps are filled in and you finish the rest.
WHAT'S INSIDE
The published triangle carries no direction - six of the 19 shapes in this wave have no directional promise written into them. This is one. Everything popularly taught about triangles is a claim the definition does not make.
And it is the symmetrical one, only - the rule needs falling highs AND rising lows. An ascending triangle fails the first, a descending triangle fails the second. No published count covers either.
One threshold, and it is the invisible one - no tolerance at all, the rule is pure inequalities. So everything rests on the smoothing, and the count runs 474 to 101. 4.7 times, same bars.
They are much rarer than they are talked about - one bar in 230 for the top and one bar in 244 for the bottom, rarer than every published shape here except their own mirror.
What the shape can honestly be used for - it describes a contraction: each swing smaller than the last. That is a real, checkable observation, and it is not a forecast.
WHAT YOU'LL BE ABLE TO DO
Mark a triangle by rule instead of by trendline.
Say why the triangle you were taught is not the one anybody counted.
State the one threshold this pattern has, and what moving it costs.
Explain why a shape with no promise cannot be tested for one.
Recognise the broadening formation as this pattern's exact mirror.
AN HONEST NOTE
A triangle is a clue, not a crystal ball. It describes what price has already done. This guide contains no win-rates, no backtest results and no promises about what you will make, because nobody can verify those and you should not trust anyone who prints them. What it hands you instead is a set of rules you can test yourself on TradingView in an afternoon. Educational, not financial advice.
Instant download. 47 pages, PDF.