


Turo Host Profit and Fleet Tracker
Turo Host Profit and Fleet Tracker Excel for Turo hosts — vehicle pricing per day, trip profit by delivery type, supplies and guest gear inventory, and a monthly P and L dashboard. Know what every rental day actually earns — after cleaning, Turo fees, car payments, and insurance.
Built for Turo hosts with one car or a small fleet who need to know, vehicle by vehicle and trip by trip, whether the daily rate covers cleaning, maintenance, Turo fees and protection, and the car payment — without accounting software. If a car is losing money, this workbook shows it before the next trip goes out.
WHAT'S INCLUDED (6 sheets):
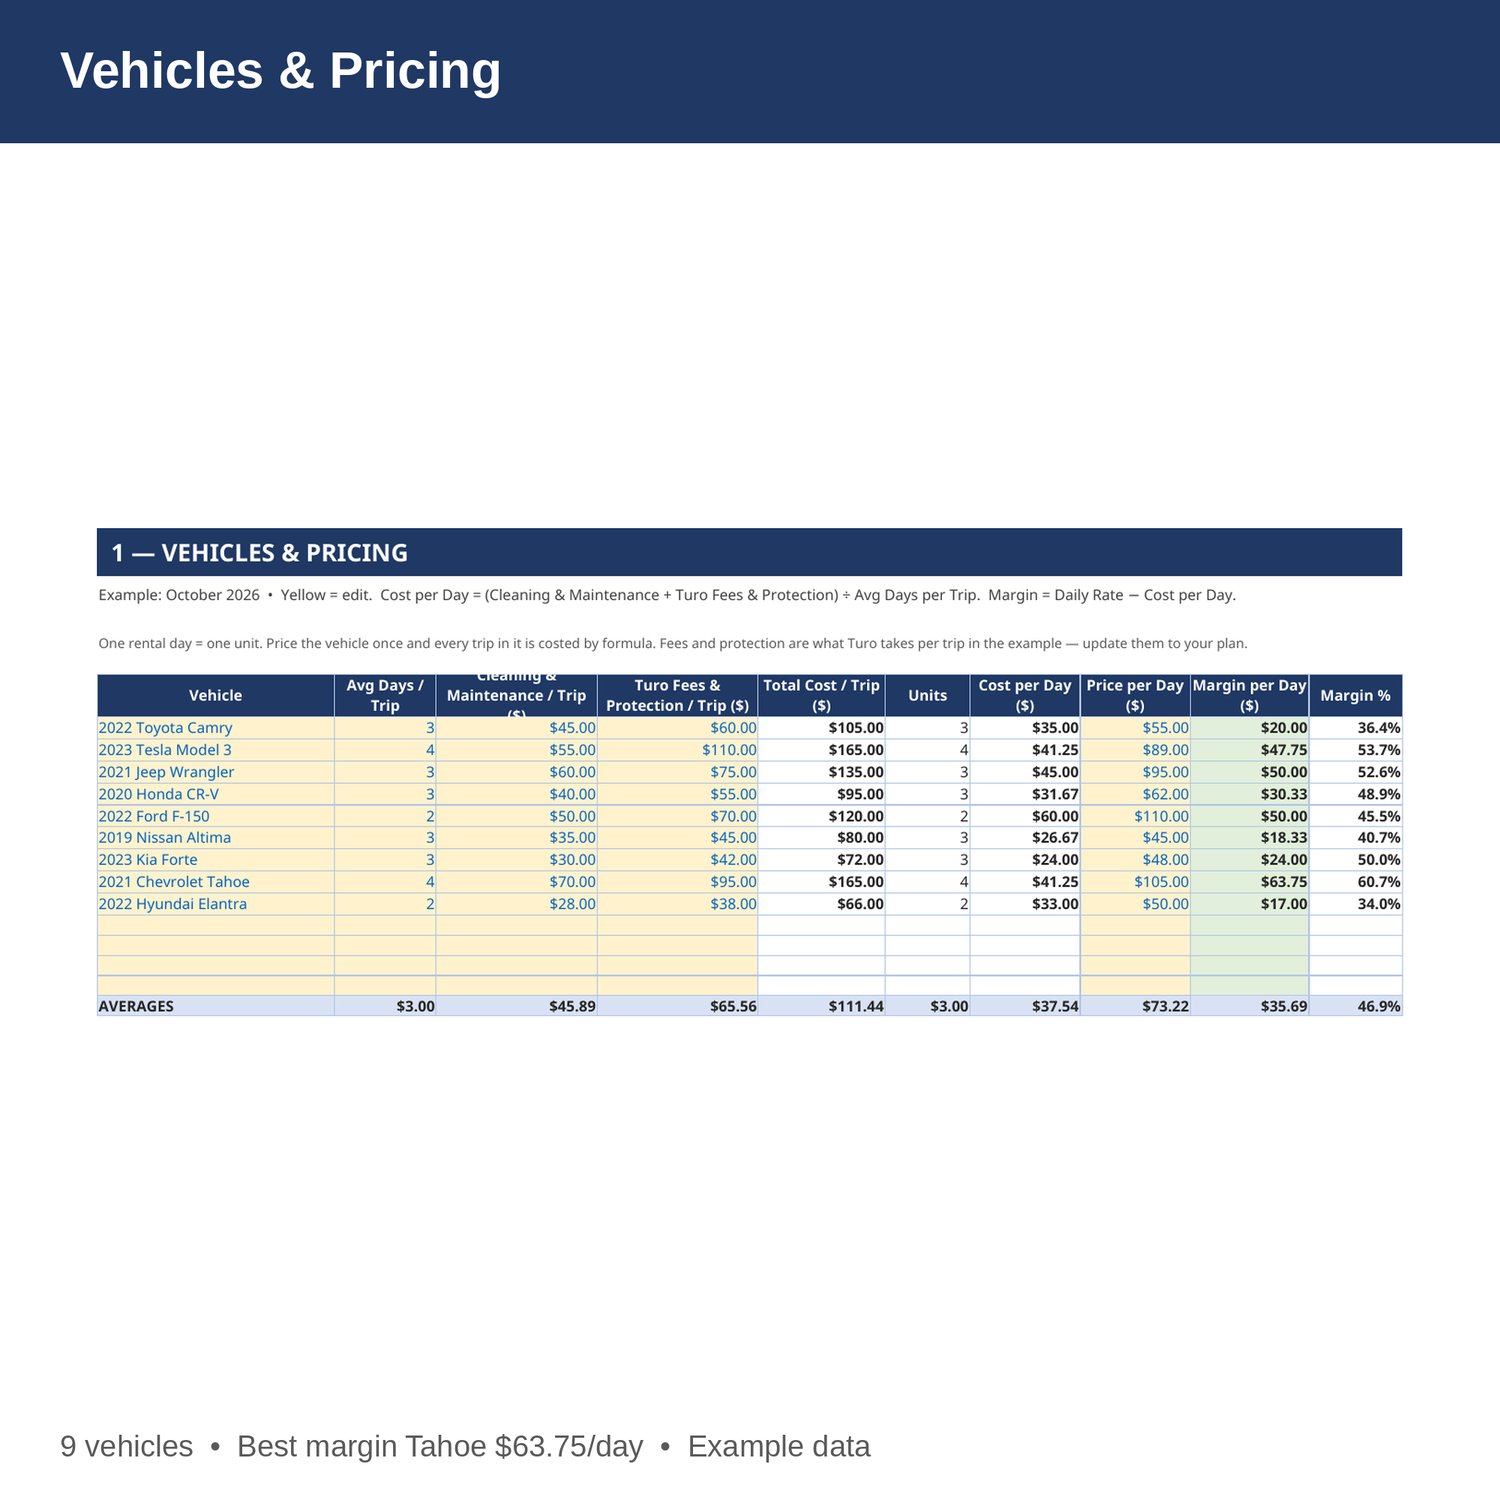
- Vehicles and Pricing — average days per trip, cleaning and maintenance cost per trip, Turo fees and protection cost per trip, cost per day, daily rate, and margin in dollars and percent for every vehicle. Change a cost and every trip profit updates by formula.
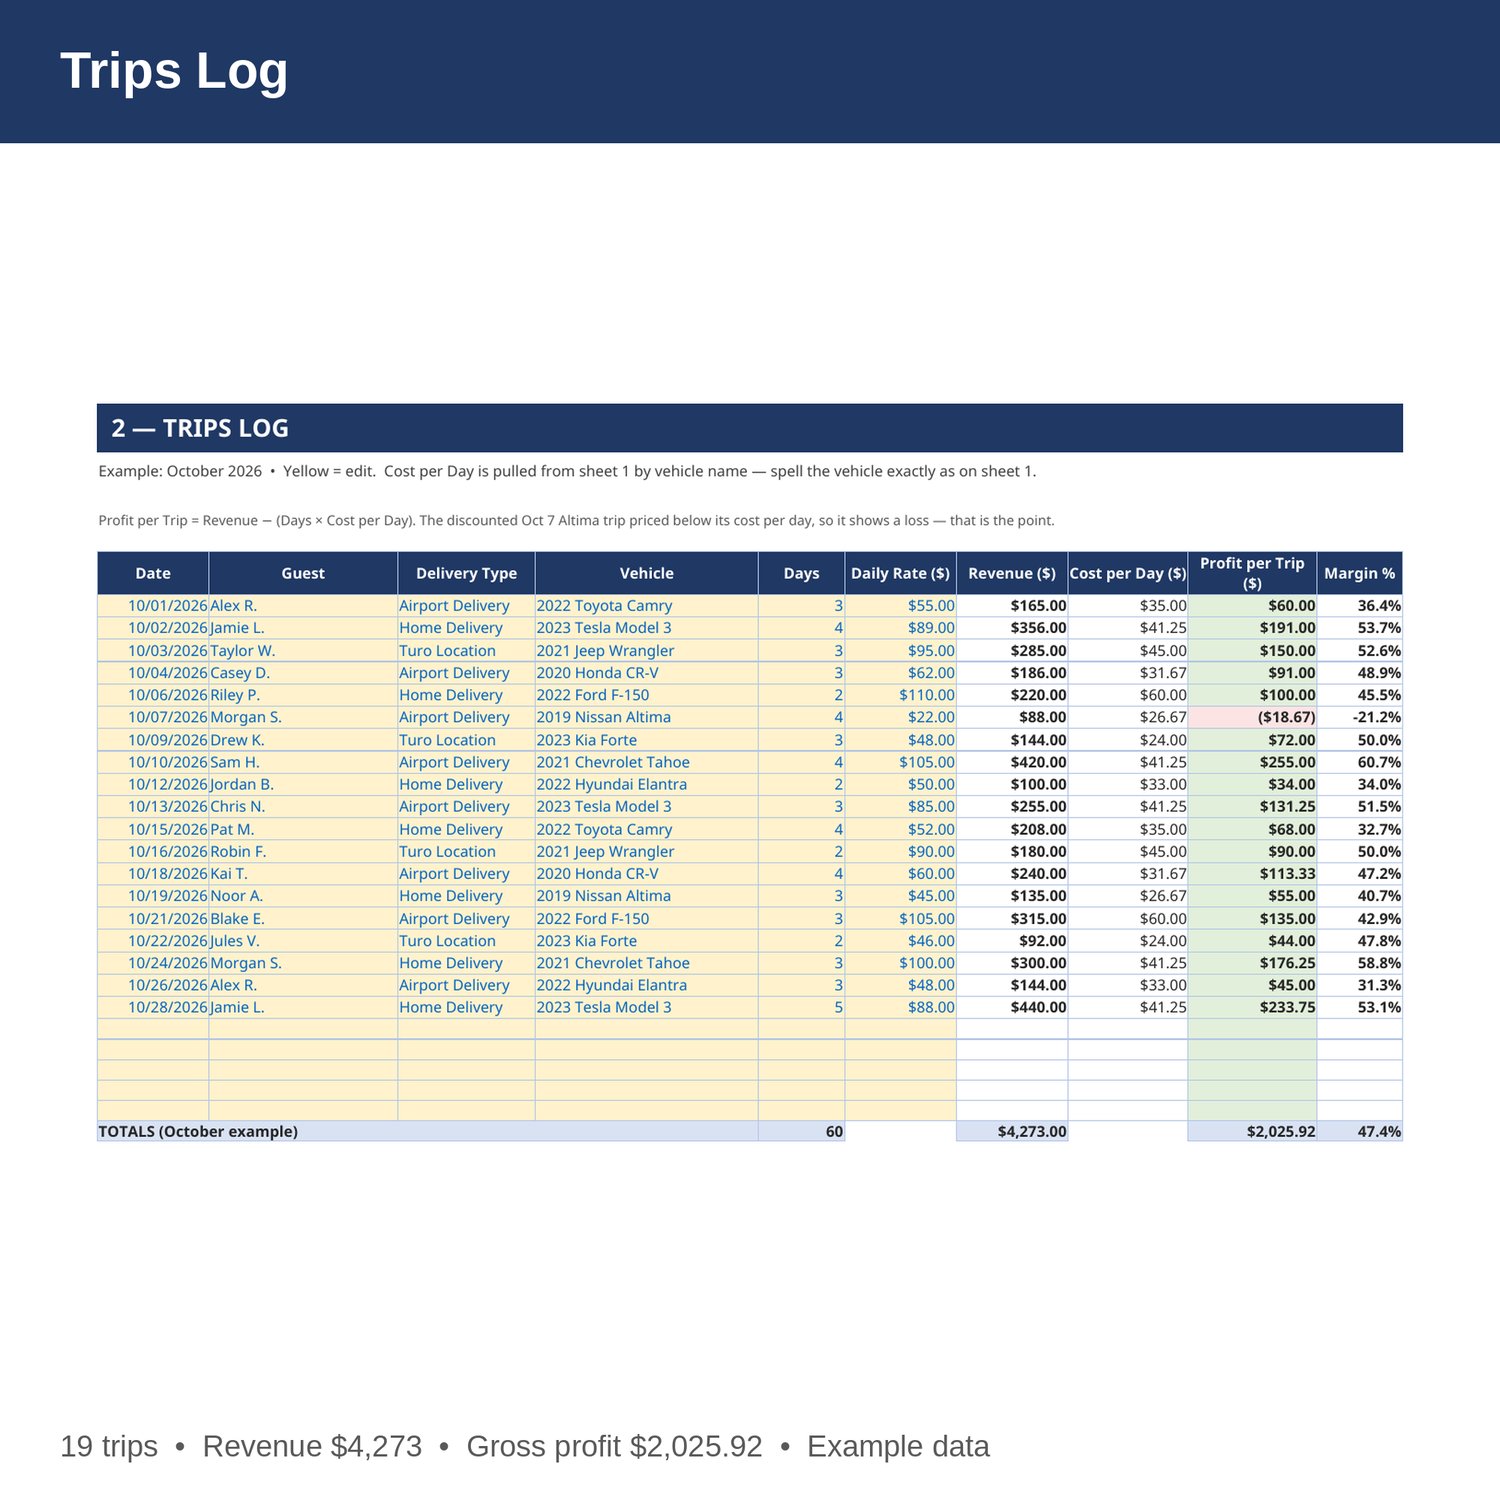
- Trips Log — date, guest, delivery type, vehicle, rental days, daily rate realized, revenue, cost per day pulled from the vehicle sheet, profit per trip, and margin. Log airport delivery, home delivery, and location pickups in one place.
- Supplies and Guest Gear — item, unit, quantity on hand, reorder point, cost per unit, and stock value. Anything at or below its reorder point is flagged LOW STOCK so you restock before the next trip.
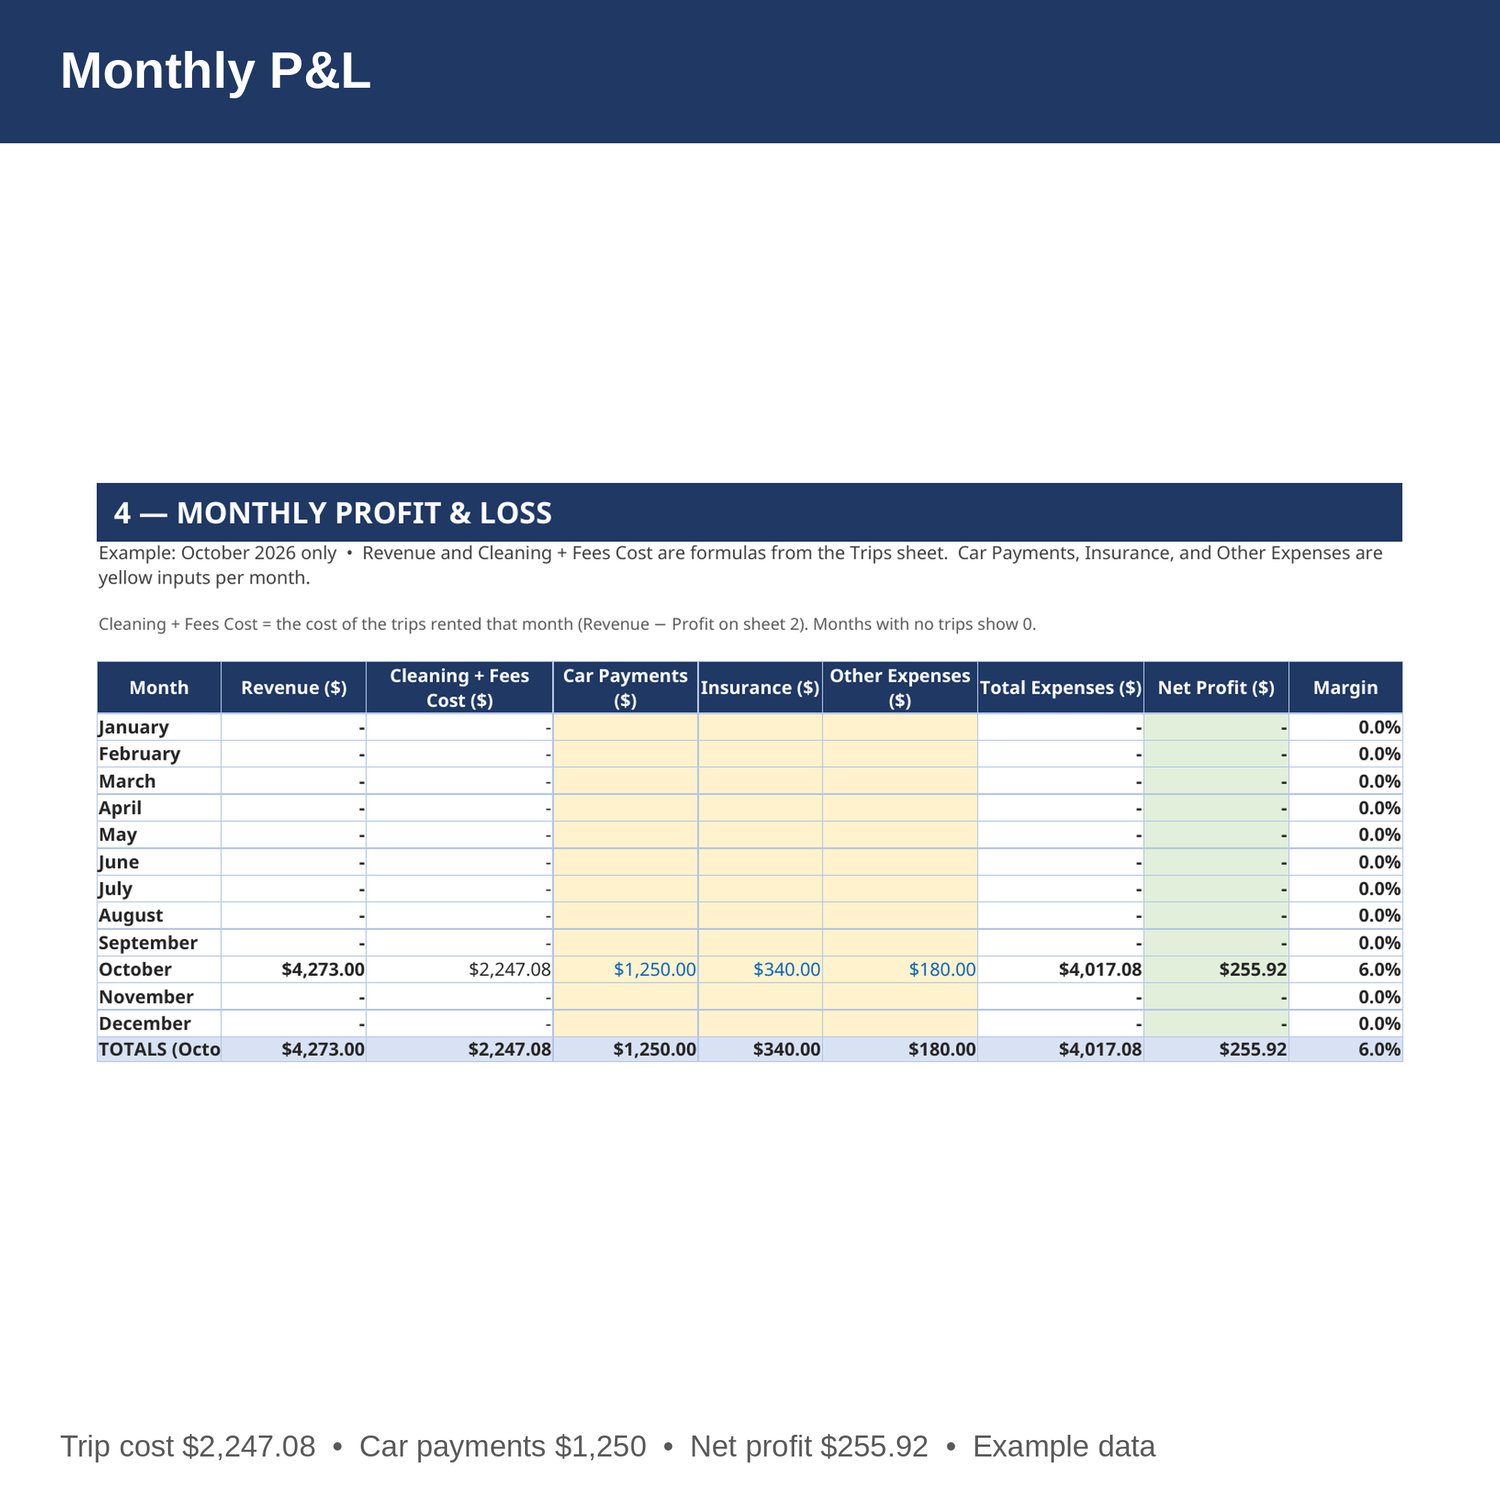
- Monthly P and L — revenue, cleaning and fees cost, car payments, insurance, and other expenses by month, Jan-Dec, with net profit and margin. Revenue and trip cost are formulas from the Trips sheet.
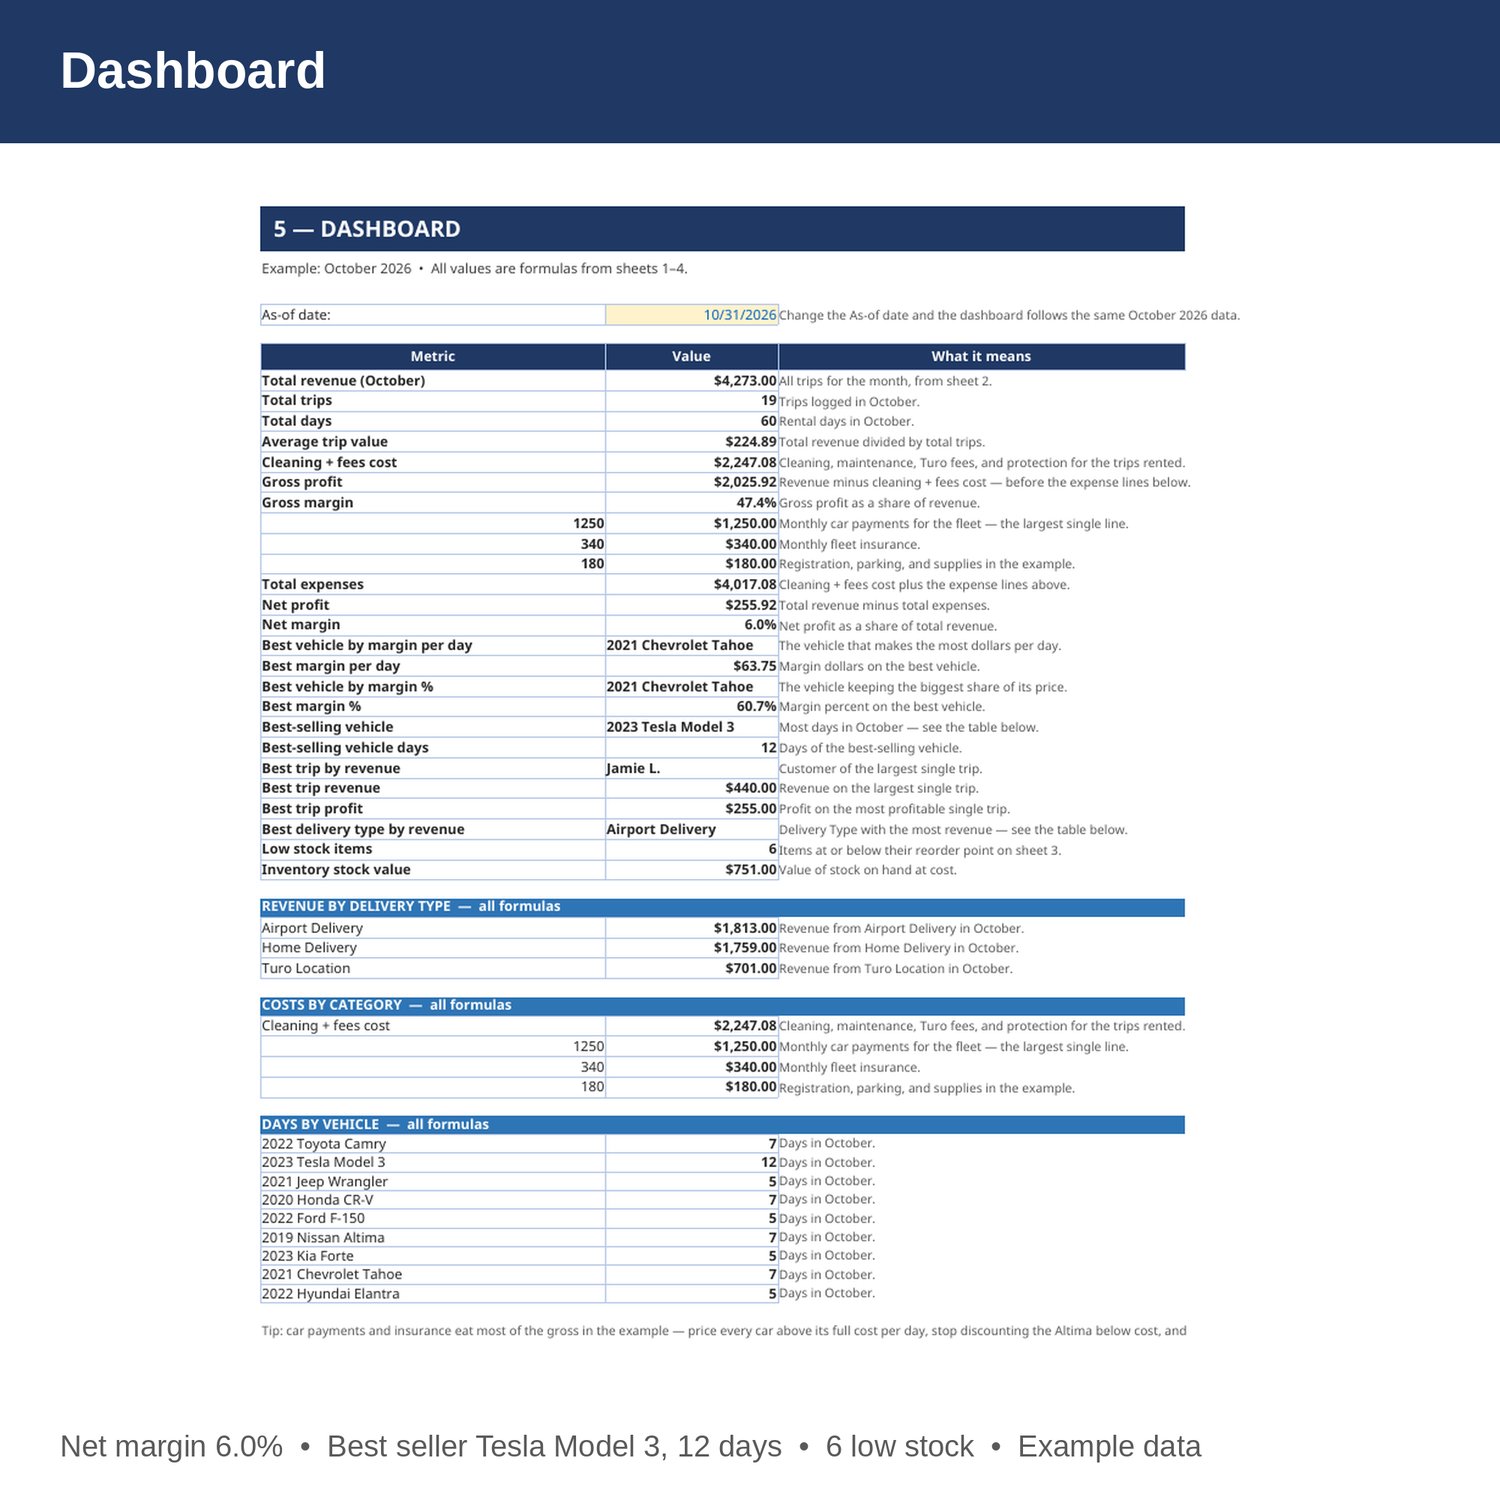
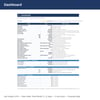
- Dashboard — total revenue, trips, rental days, average trip value, gross and net profit and margin, best vehicle by margin per day and by margin percent, best-selling vehicle, best trip and best delivery type, costs by category, and low stock count.
- Cover and How to Use — start here. Yellow cells are the only ones you edit.
EXAMPLE DATA (October 2026 — replace with your own numbers):
- Total revenue 4,273 from 19 trips and 60 rental days; average trip value 224.89.
- Cleaning plus fees cost 2,247.08; gross profit 2,025.92; gross margin 47.4 percent.
- Car payments 1,250, insurance 340, other expenses 180; total expenses 4,017.08; net profit 255.92; net margin 6.0 percent.
- Revenue by delivery type: Airport Delivery 1,813 (best), Home Delivery 1,759, Turo Location 701.
- Best vehicle by margin per day and by margin percent: 2021 Chevrolet Tahoe, margin 63.75 per day, 60.7 percent (cost 41.25 per day, price 105 per day).
- Best-selling vehicle: 2023 Tesla Model 3, 12 rental days.
- Best trip by revenue: Jamie L., October 28, Tesla Model 3 x5 days — revenue 440.
- Inventory example: stock value 751, with 6 items at or below their reorder point — Child Car Seats, Phone Chargers USB-C, Phone Chargers Lightning, Cleaning Spray, Ice Scrapers, and Water Bottles (guest).
HOW IT WORKS:
1. Download the Excel file instantly after purchase.
2. On sheet 1, enter each vehicle's average days per trip, cleaning and maintenance cost per trip, Turo fees and protection cost per trip, and daily rate. Cost per day and margin fill in by formula.
3. On sheet 2, log every trip: date, guest, delivery type, vehicle (spelled exactly as on sheet 1), rental days, and daily rate realized. Revenue, cost per day, and profit fill in by formula.
4. On sheet 3, keep quantities on hand current and set a reorder point for each item. Buy more of anything flagged LOW STOCK before the next trip.
5. On sheet 4, enter car payments, insurance, and other expenses each month, then check gross and net profit on the Dashboard.
HOW THE NUMBERS WORK:
Cost per day is (cleaning and maintenance cost per trip plus Turo fees and protection cost per trip) divided by average days per trip. Margin per day is price per day minus cost per day. Margin percent is margin per day divided by price per day. Gross profit is revenue minus cleaning and fees cost; net profit is revenue minus cleaning and fees cost, car payments, insurance, and other expenses. One rental day is one unit.
WHO IT'S FOR:
Turo hosts and small car-sharing fleet owners who want vehicle pricing, trip profit, guest gear inventory, and a monthly P and L in one workbook — without accounting software.
PLEASE NOTE:
- This is a digital download. No physical item will be shipped.
- Works in Microsoft Excel and Google Sheets (upload to Google Drive to open in Sheets).
- Example data for October 2026 is included (9 vehicles, 19 trips, 60 rental days, 12 supply items). Replace it with your own numbers.
- The example is honest about the weak spots: car payments (1,250) and insurance (340) eat most of the gross profit, one discounted Nissan Altima trip on October 7 priced at 22 per day, below its 26.67 cost per day, and the slowest car in the fleet, the Altima, barely covers its share of the monthly payment — net margin is only 6.0 percent.
- This is a bookkeeping and planning tool only, not tax, legal, or CPA advice.
- Due to the nature of digital downloads, refunds are not available. Message me before buying if you have a question.
Built by an accountant: B.S. Accountancy, ASU W. P. Carey, with revenue-reconciliation experience at Marriott and audit work at PwC.