






Volume Analysis Basics
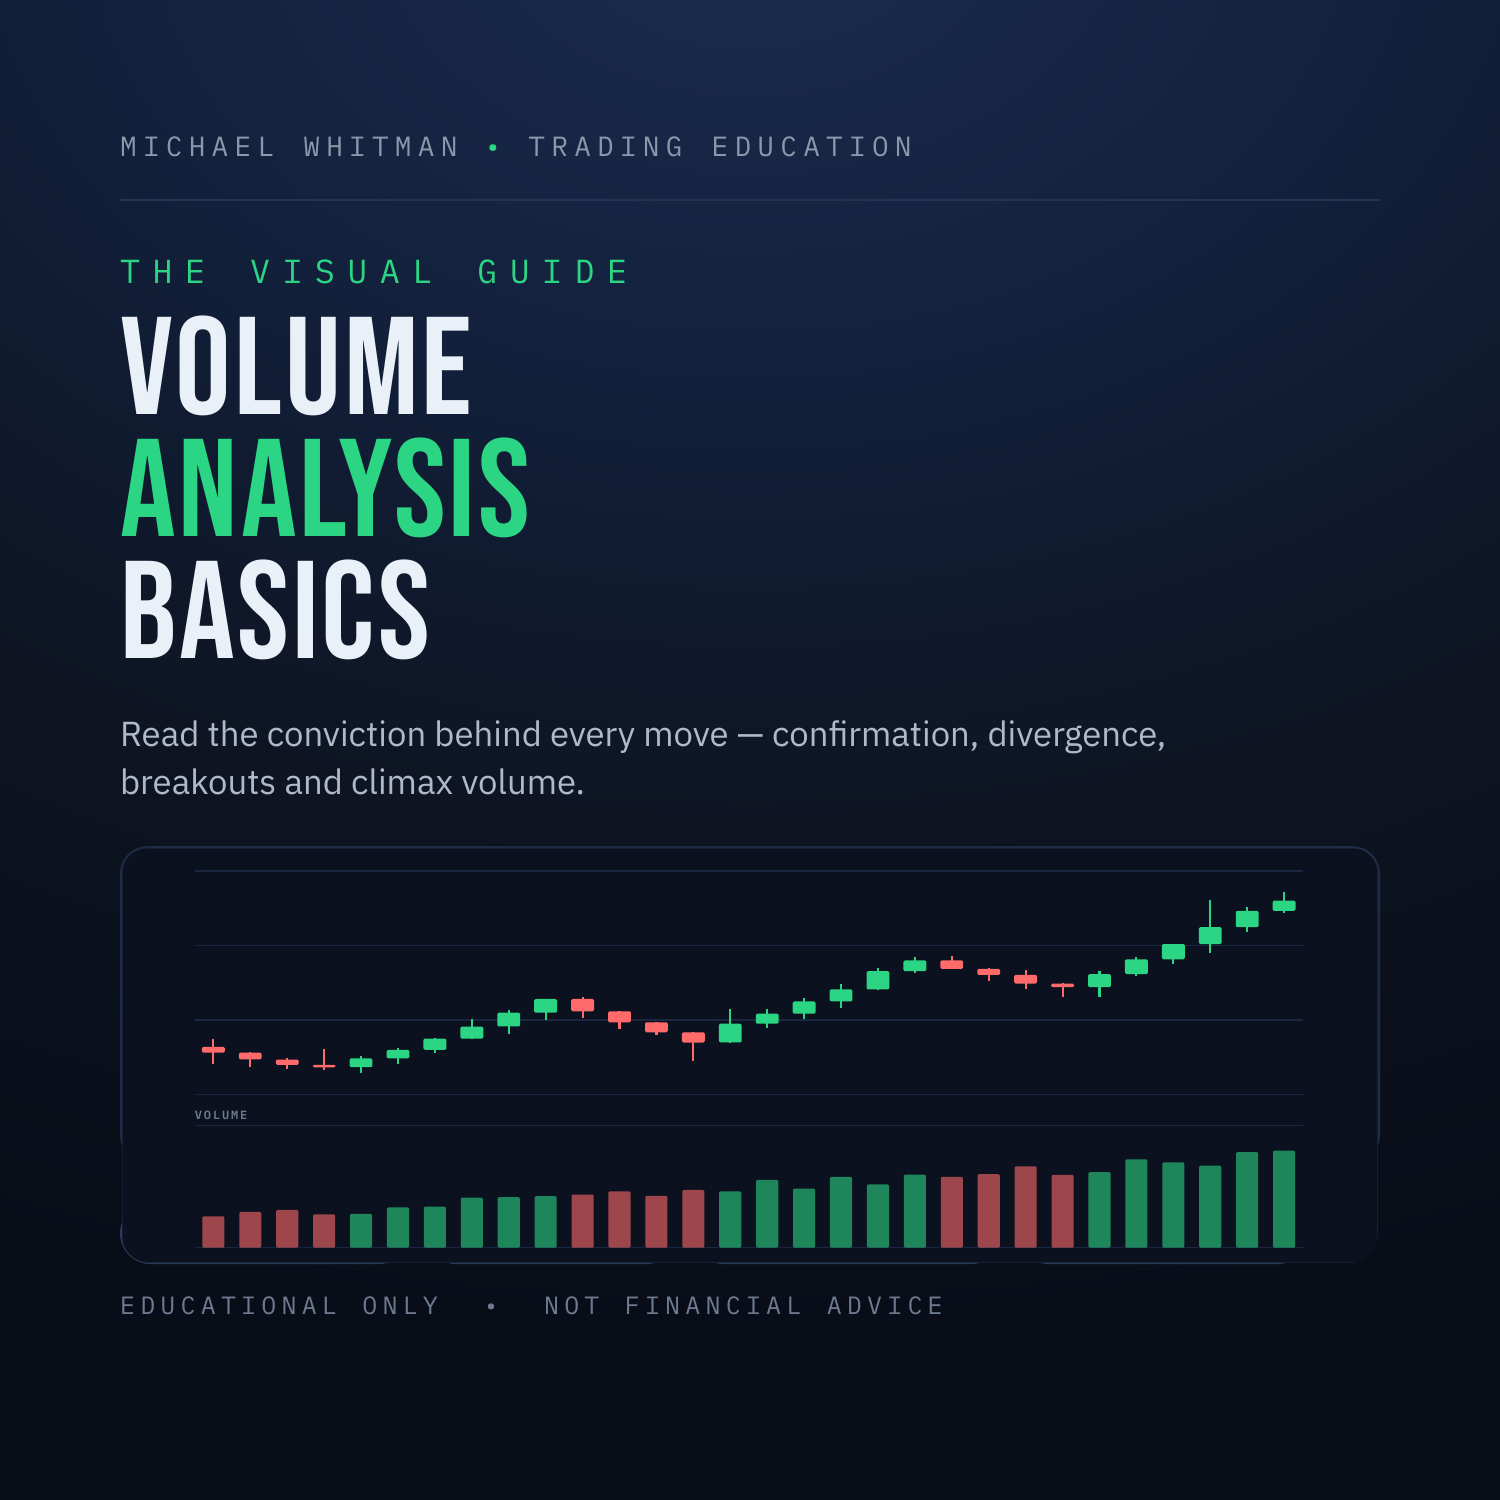
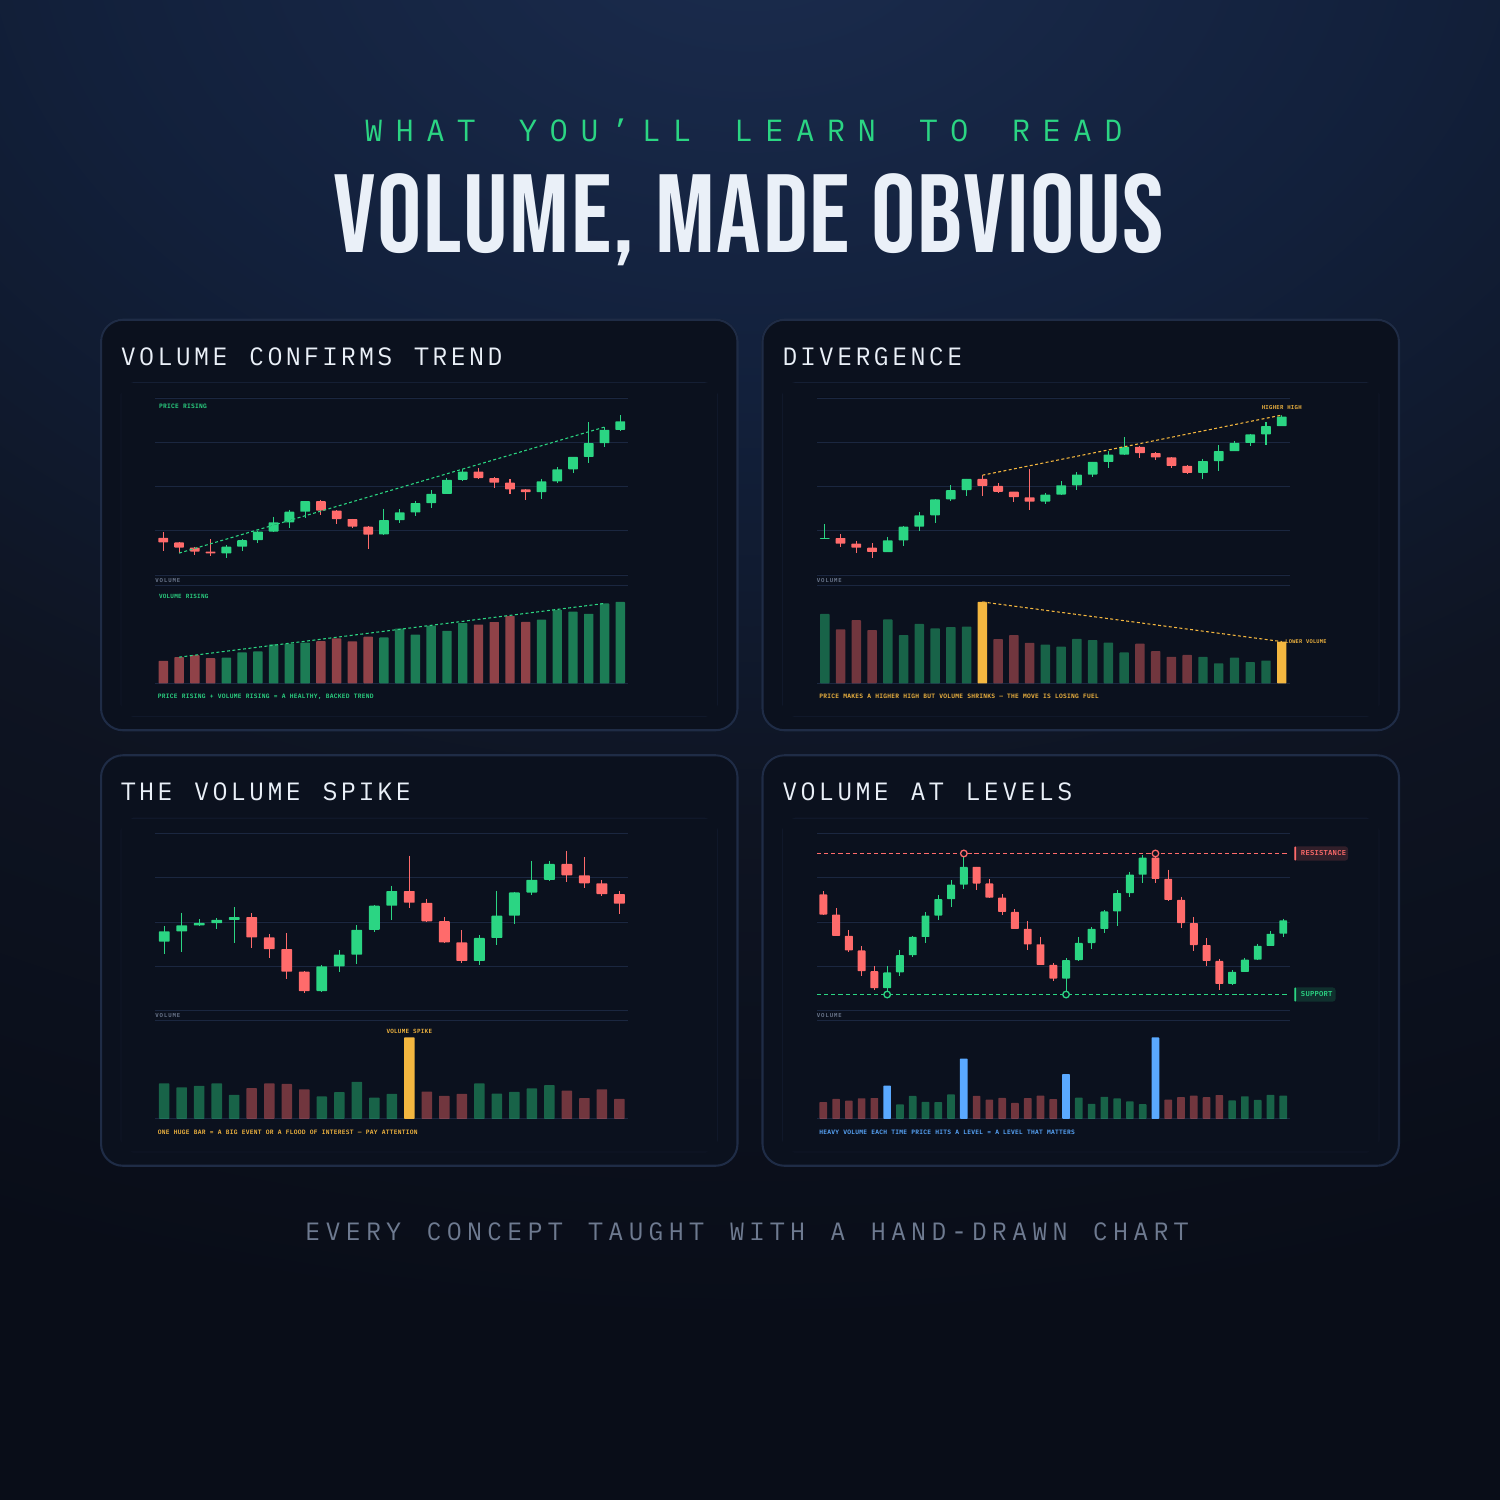
Price tells you where the market went. Volume tells you whether anyone meant it. Most beginners stare at candles and ignore the bars underneath them — and miss the single best clue to whether a move is real. This visual, no-fluff guide fixes that. No jargon, no hour-long lectures. Just how to read volume and use it. WHAT'S INSIDE - What Volume Is — the bars under price, explained simply - Volume Confirms the Trend — why rising price needs rising volume - Volume Divergence — the early warning a move is running out of fuel - Breakouts Need Volume — telling a real breakout from a fakeout - The Volume Spike — what one giant bar is screaming at you - Climax & Exhaustion — spotting the top or bottom of a move - Volume at Key Levels — proving which levels actually matter - Strong vs Weak Volume — knowing which moves the crowd backs WHAT YOU'LL BE ABLE TO DO - Confirm a trend or breakout before you trust it - Spot divergence and exhaustion before the turn - Tell a real breakout from a trap - Read conviction instead of guessing Every concept is taught with a clean, hand-drawn price + volume chart — so you see exactly what it looks like in the wild. HONEST NOTE Volume adds context to price — it doesn't predict the future. Heavy volume shows up at tops and bottoms alike, and no signal works every time. This guide is educational only and is not financial advice. Always use a stop and manage your risk. WHAT YOU GET - An instant-download PDF guide (11 pages) - Yours to keep and re-read anytime Pairs perfectly with "How to Draw Key Levels on Any Chart" and "Trend Lines & Channels Explained" — levels, trend lines, and volume are the three core skills for reading any chart.