

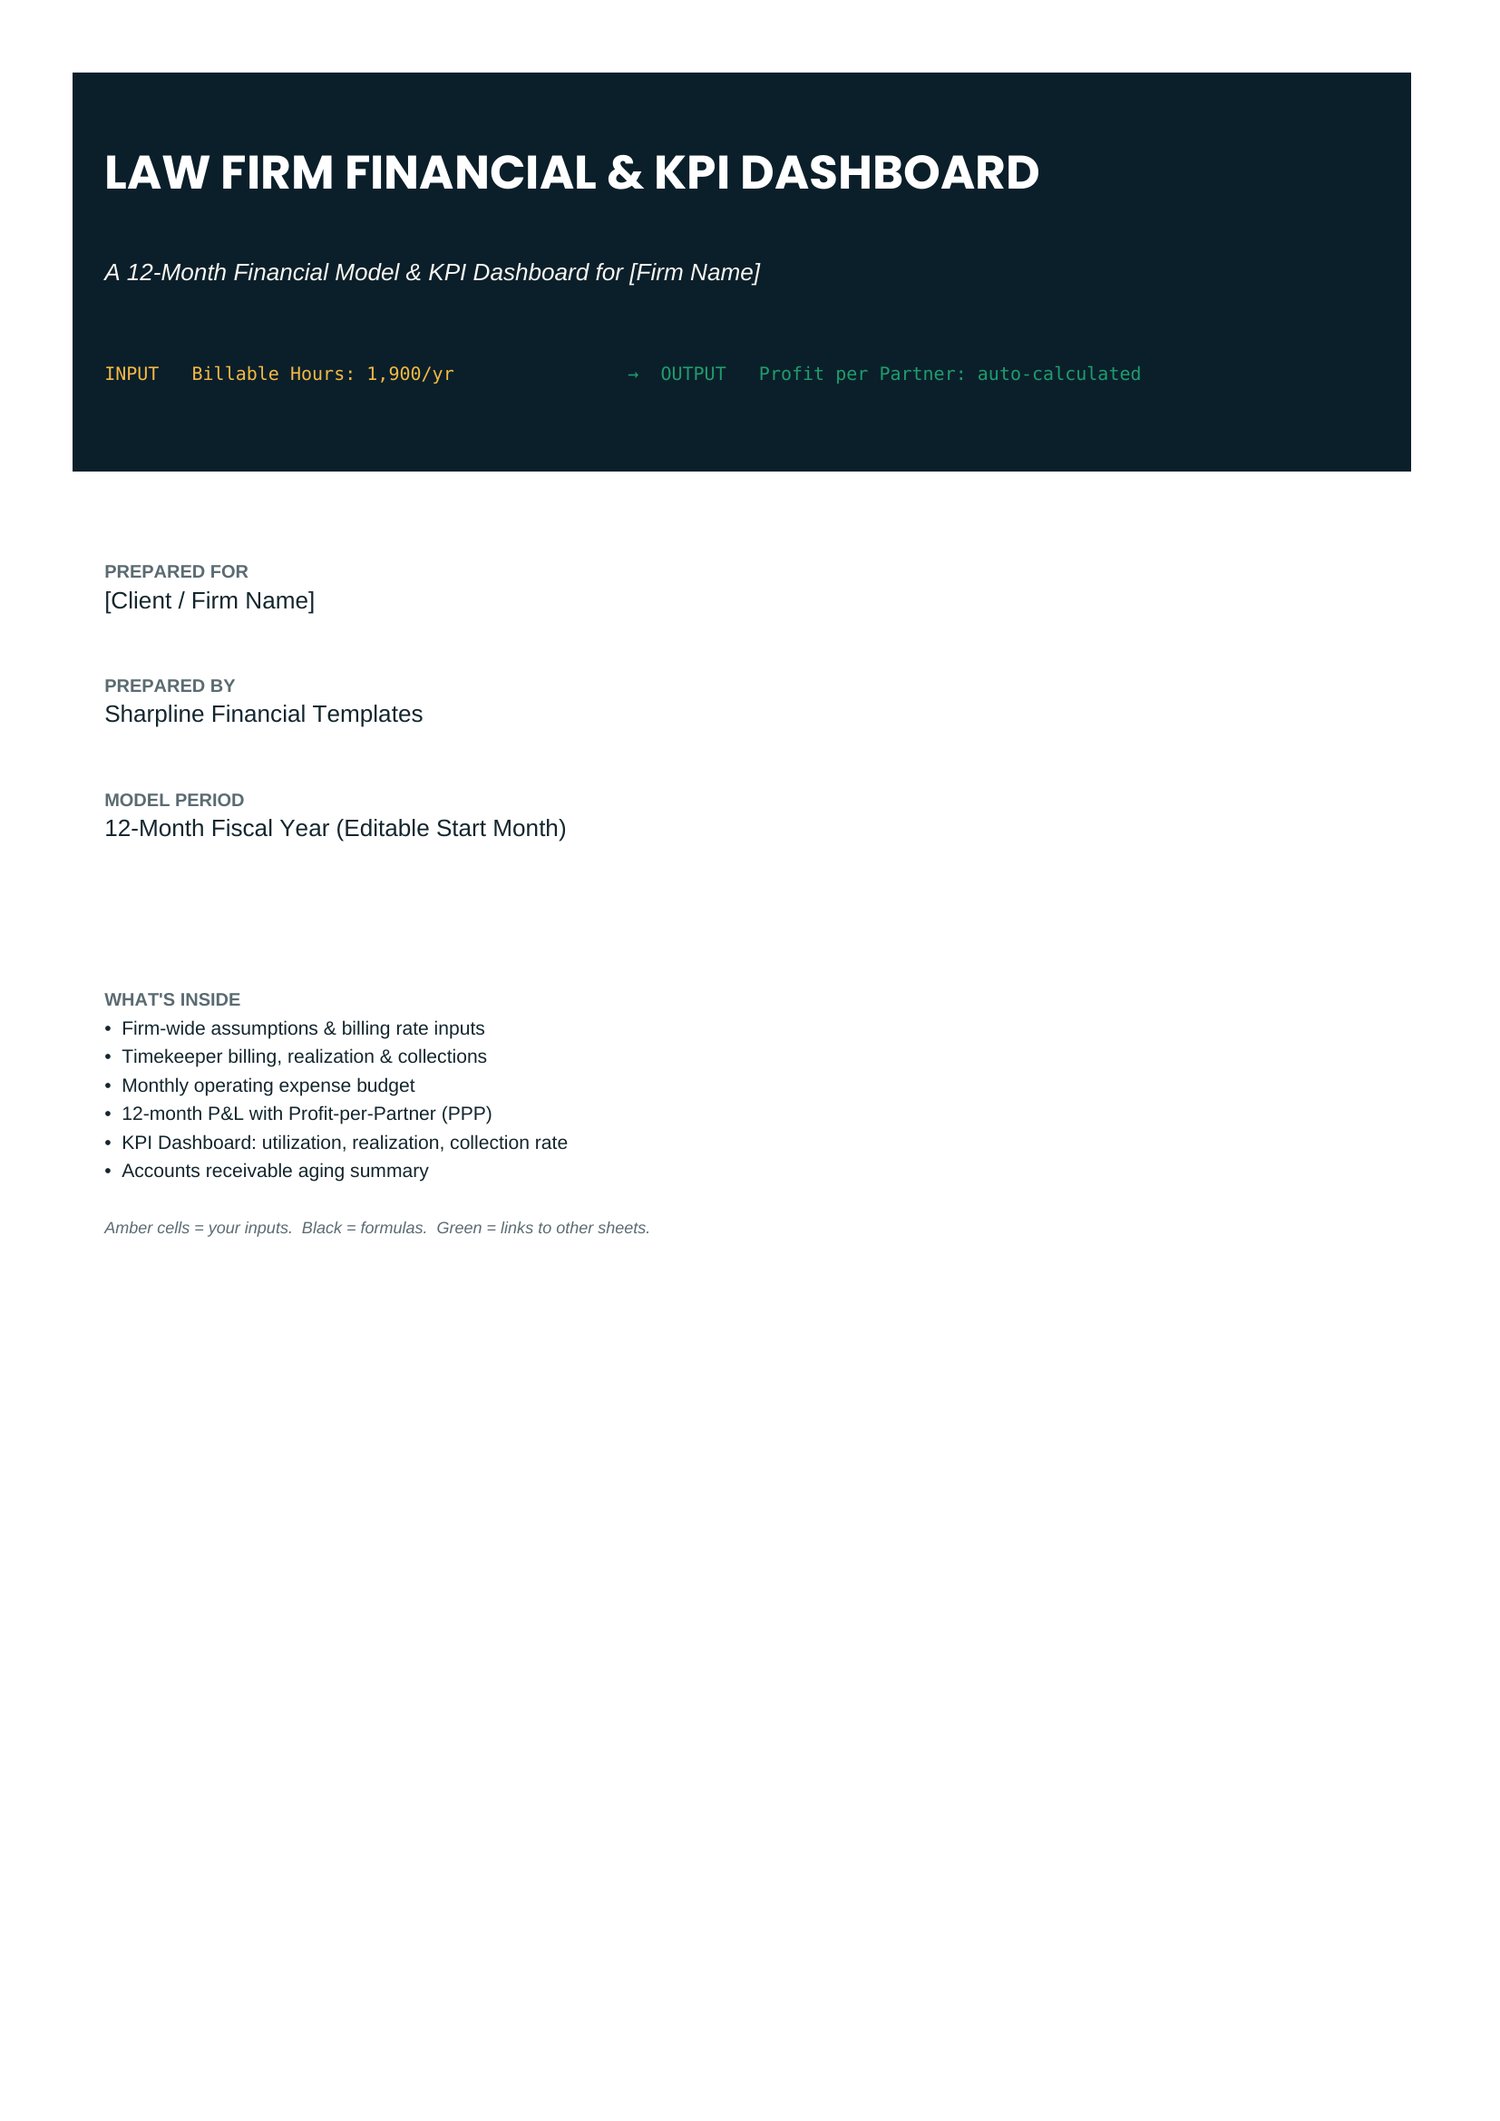



Law Firm Financial & KPI Dashboard (Excel Template)
**Run your law firm's numbers the way managing partners actually think about them.**
This 12-month Excel model turns billable hours, realization, and collections into a
live financial picture — revenue, expenses, profit per partner, and the KPIs that
actually drive a firm's bottom line. Built for solo practitioners, small firms, and
practice-group leaders who want a real financial model, not a generic budget template.
**What's inside:**
- Firm-wide Assumptions sheet — headcounts, billing rates, target utilization,
realization, and collection rates, plus your monthly overhead budget.
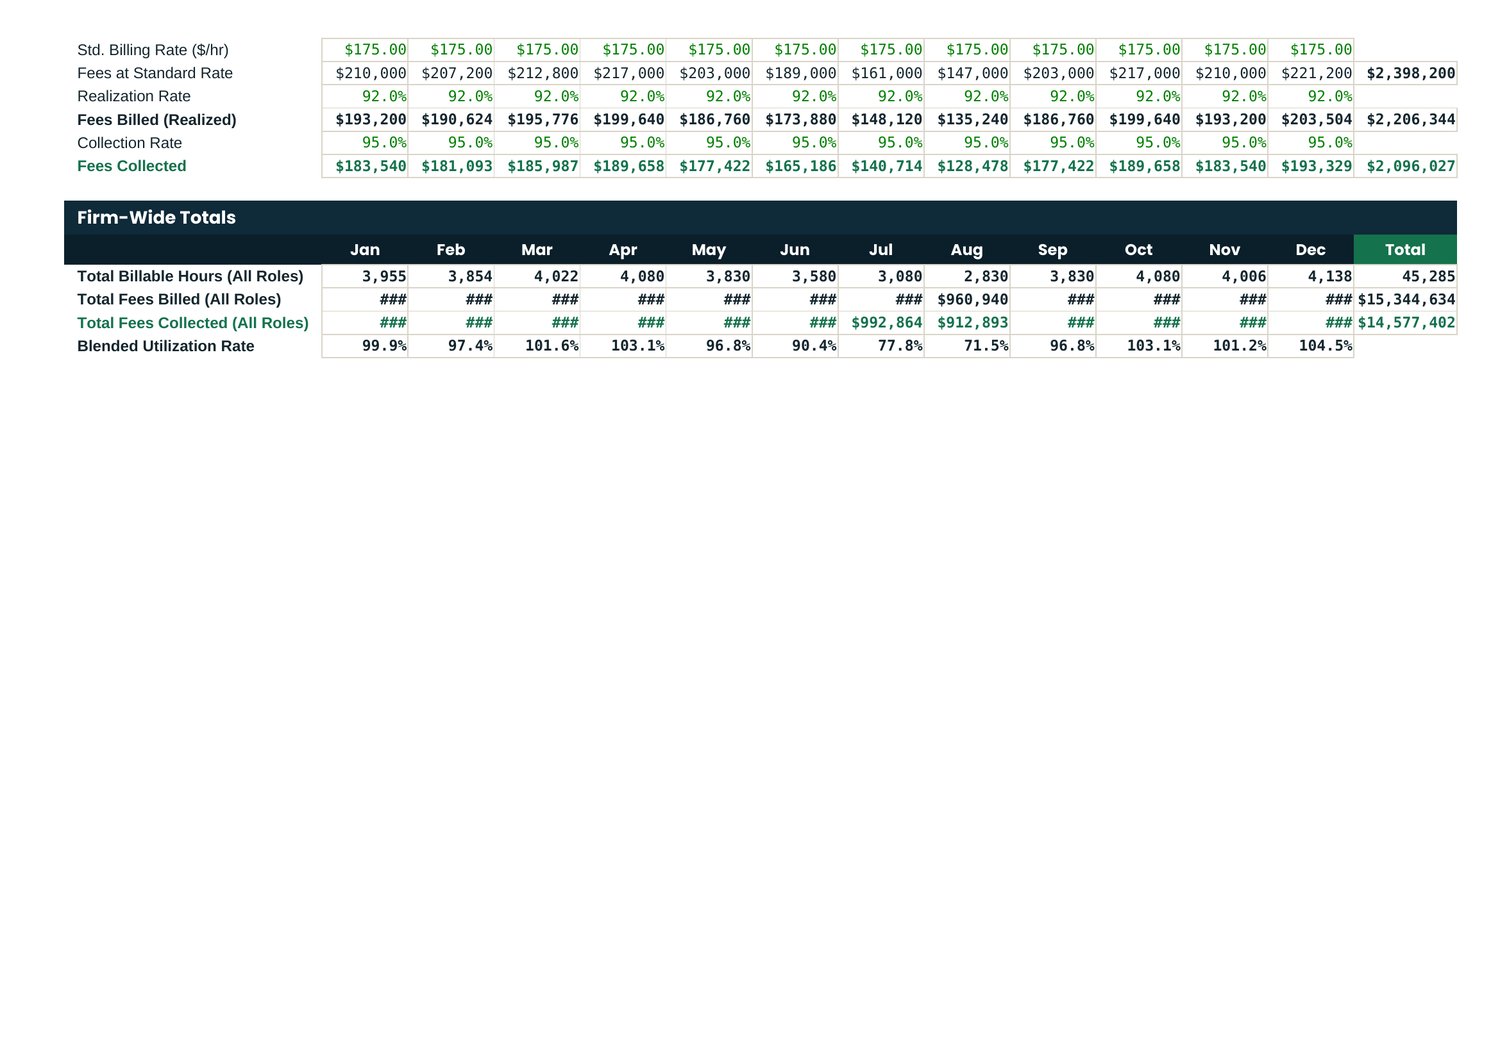
- Timekeeper Billing sheet — monthly billable hours by role, rolled up into fees at
standard rates, fees billed, and fees collected.
- Expenses sheet — a full monthly operating expense budget by category.
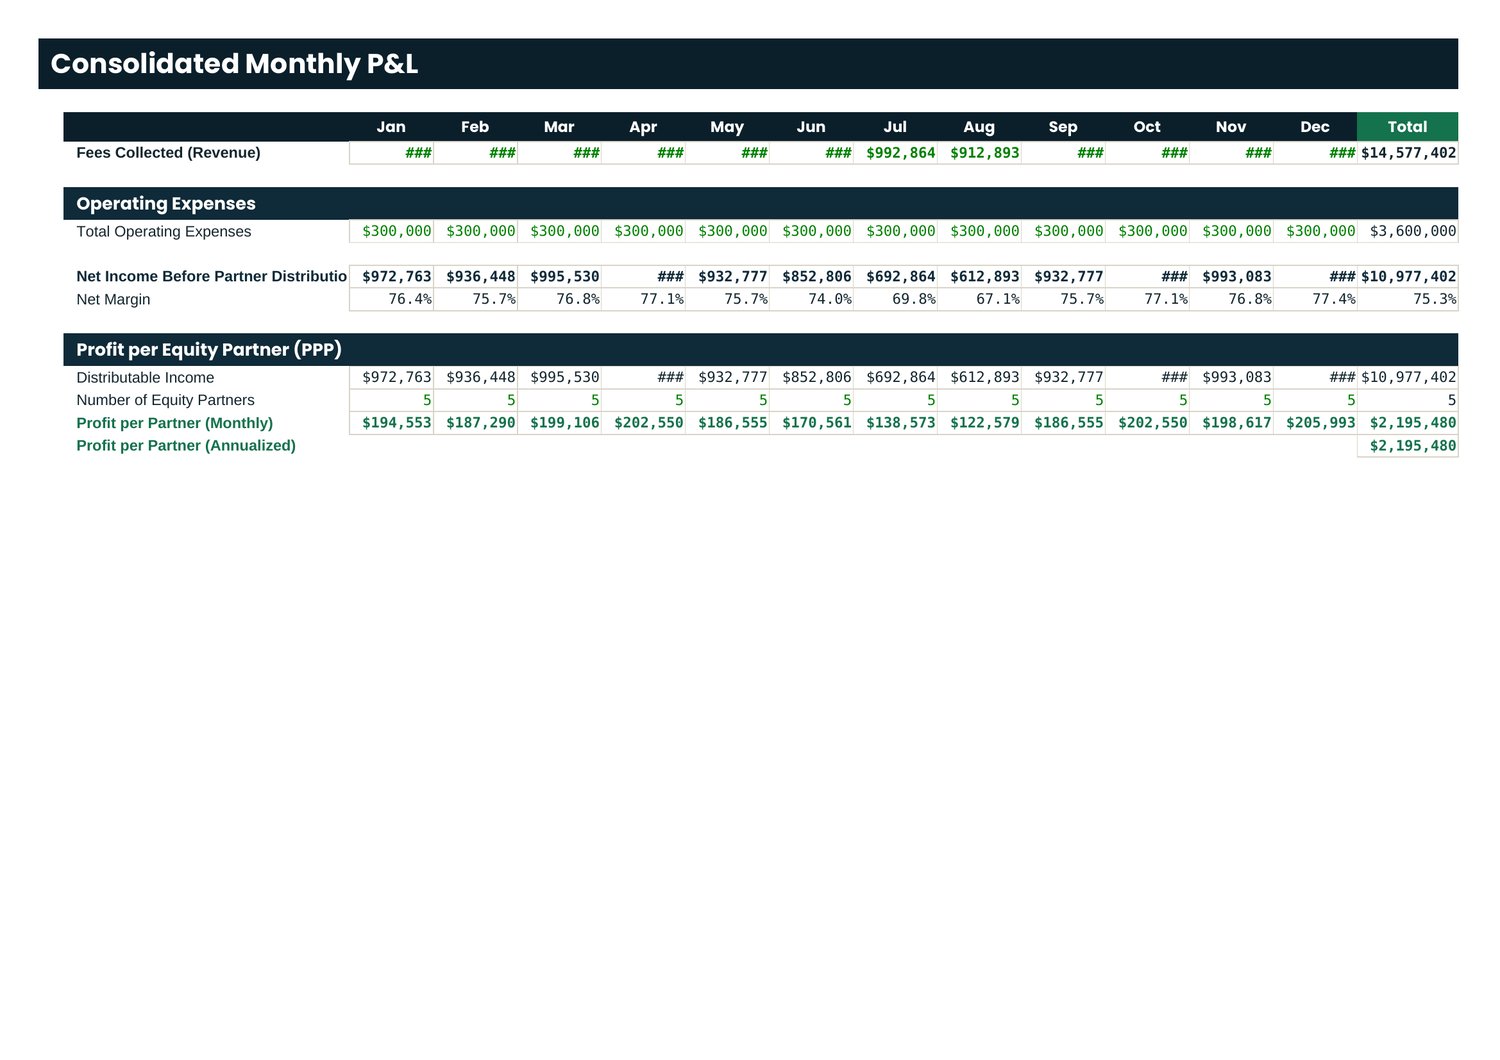
- Consolidated P&L — monthly income statement with Profit-per-Partner (PPP),
calculated automatically from your inputs.
- KPI Dashboard — live scorecards and charts for utilization rate, realization rate,
collection rate, revenue per lawyer, overhead ratio, and monthly trends.
- Accounts Receivable Aging — a roll forward with an aging-bucket breakdown.
**Who it's for:**
Managing partners, firm administrators, and solo attorneys who want to see
utilization, realization, and collections in one place instead of three different
reports — and who want profit-per-partner to update automatically as the year's
numbers come in.
**Format:**
One Excel workbook (.xlsx), fully formula-driven — every chart and KPI recalculates
the moment you change an input. Color-coded cells show you exactly what to edit
(amber) versus what's a formula (everything else). A PDF reference copy is included.
No macros, no add-ins required — works in Excel 2016 and later, and in Google Sheets
after upload.