
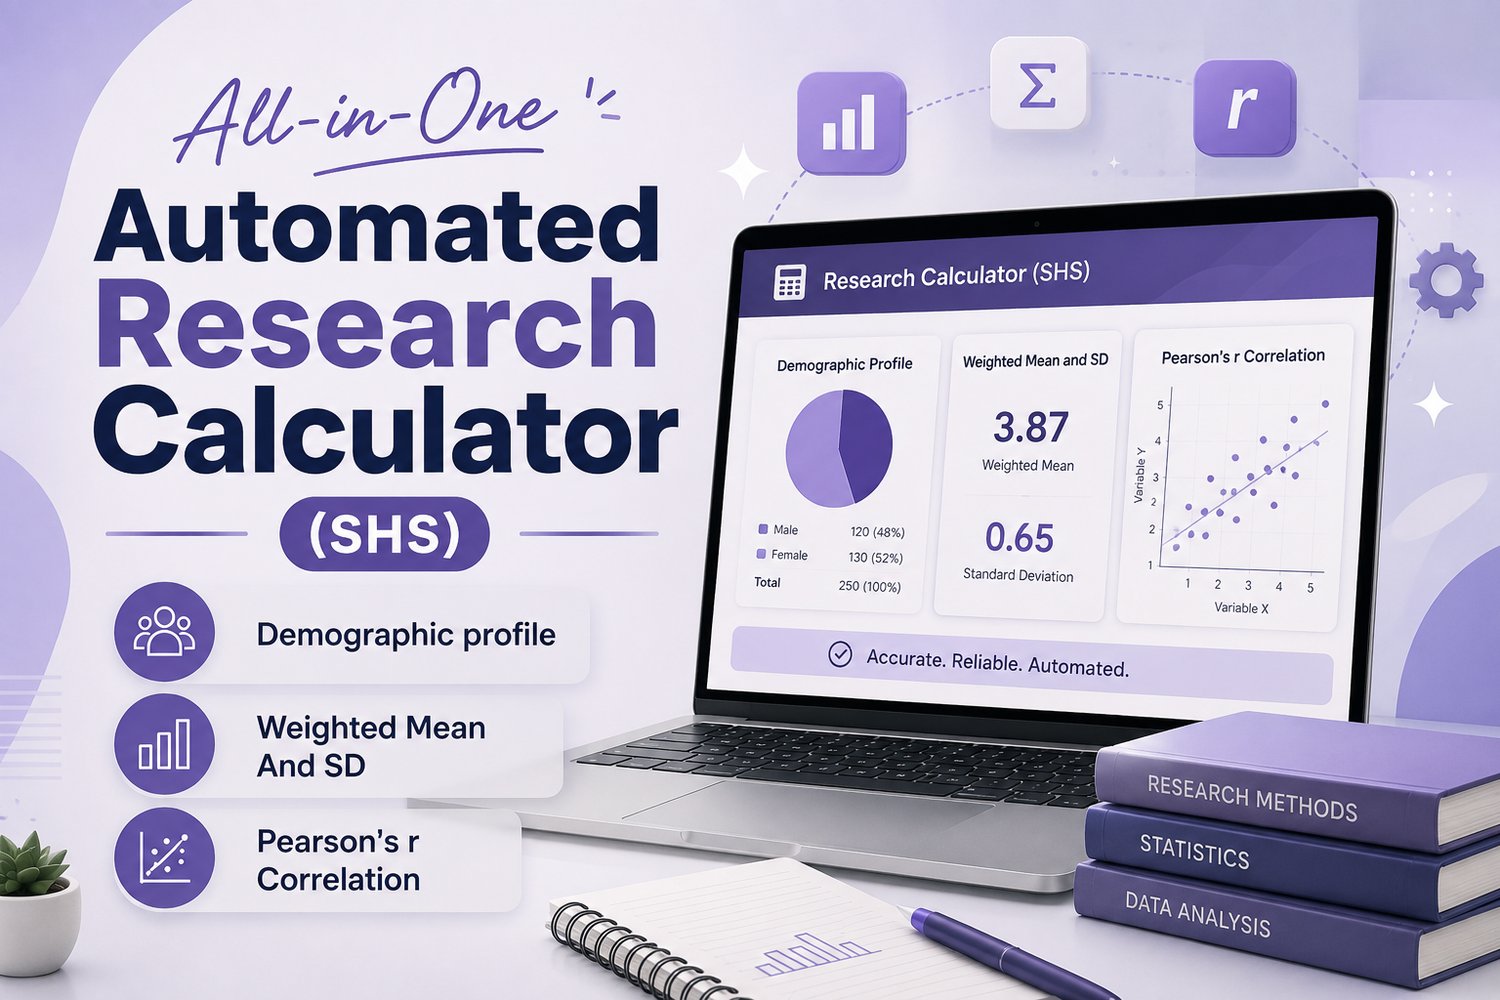

All-in-One Automated Research Calculator (SHS)
**Struggling with Thesis Statistics and Data Interpretation? Let Excel do the heavy lifting!** 📊✨
Designed for high school, undergraduate, and college research students, this **Premium Automated Research Statistical Calculator** eliminates the stress of manual data processing. No complex coding or advanced math skills required—just plug in your raw survey data and get instant, research-ready results!
This is a **100% Plug-and-Play Microsoft Excel Template** that automatically computes your statistics and writes contextual interpretations for you.
---
### 🌟 WHAT’S INSIDE THE BUNDLE?
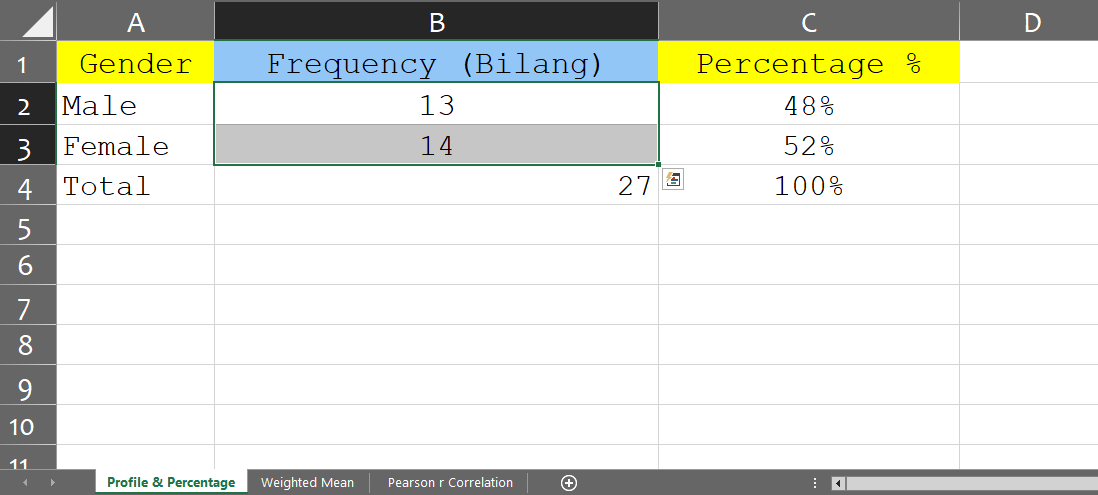
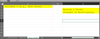
1. **📊 Demographic Profile Generator**
* Instantly calculates frequency distributions and percentages (%).
* Automatically generates a clean, dynamic Pie Chart.
* Spits out an automated summary sentence (e.g., *"Based on the data, the majority of the respondents are..."*).
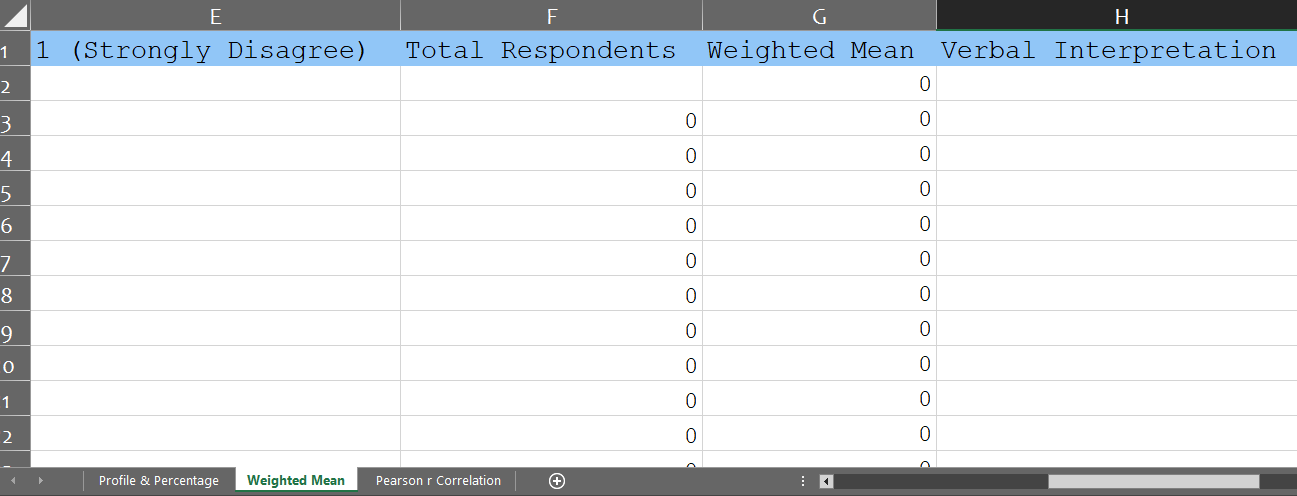
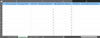
2. **📝 Likert Scale & Weighted Mean Analyzer (with SD)**
* Simply input your response tallies per scale (4, 3, 2, 1).
* Instantly computes the **Weighted Mean** and **Standard Deviation (SD)** for grouped data.
* Auto-generates a dynamic Bar Graph and gives the exact Verbal Interpretation scale.
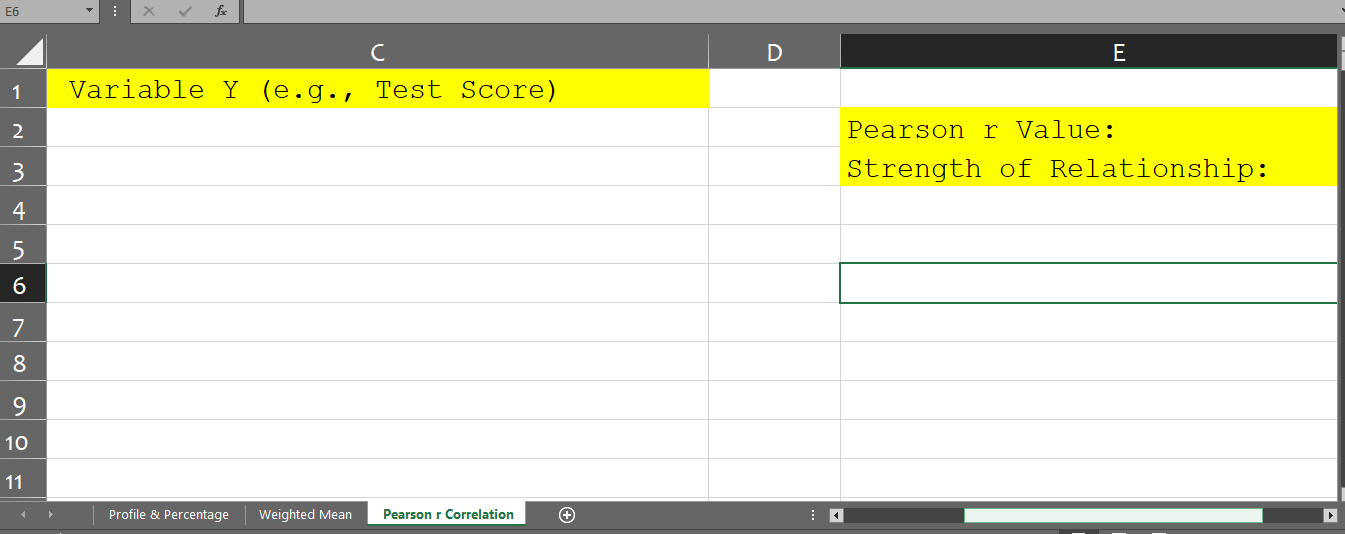
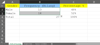
3. **🔗 Pearson’s r Correlation Solver**
* Input your Variable X and Variable Y scores for all respondents.
* Instantly calculates the exact *r-value*.
* Automatically writes a contextual sentence identifying the **Strength and Direction** of the relationship (e.g., *"The data indicates a STRONG POSITIVE relationship..."*).
### 📥 HOW IT WORKS:
1. Complete your purchase and download the Excel file + User Guide PDF.
2. Open the file and input your raw tallies or scores into the **YELLOW cells**.
3. Copy the automated tables and charts directly into your Chapter 4 (Presentation and Analysis of Data)!
*Stop drowning in manual statistical computations. Finish your research paper on time and ace your final defense!* 🎓🏆