

Airbnb Turnover Cleaning Tracker
Airbnb Turnover Cleaning Tracker Excel with turnover log, property summary, supplies and mileage, monthly P and L, and a per-hour dashboard. Know what every turnover actually made — after supplies, laundry, and mileage.
Built for Airbnb and short-term rental hosts and cleaning teams who need to know, turnover by turnover, whether the cleaning fee covers the clean — without accounting software. If a property is losing money on the clean, this workbook shows you before the next guest checks in.
WHAT'S INCLUDED (6 sheets):
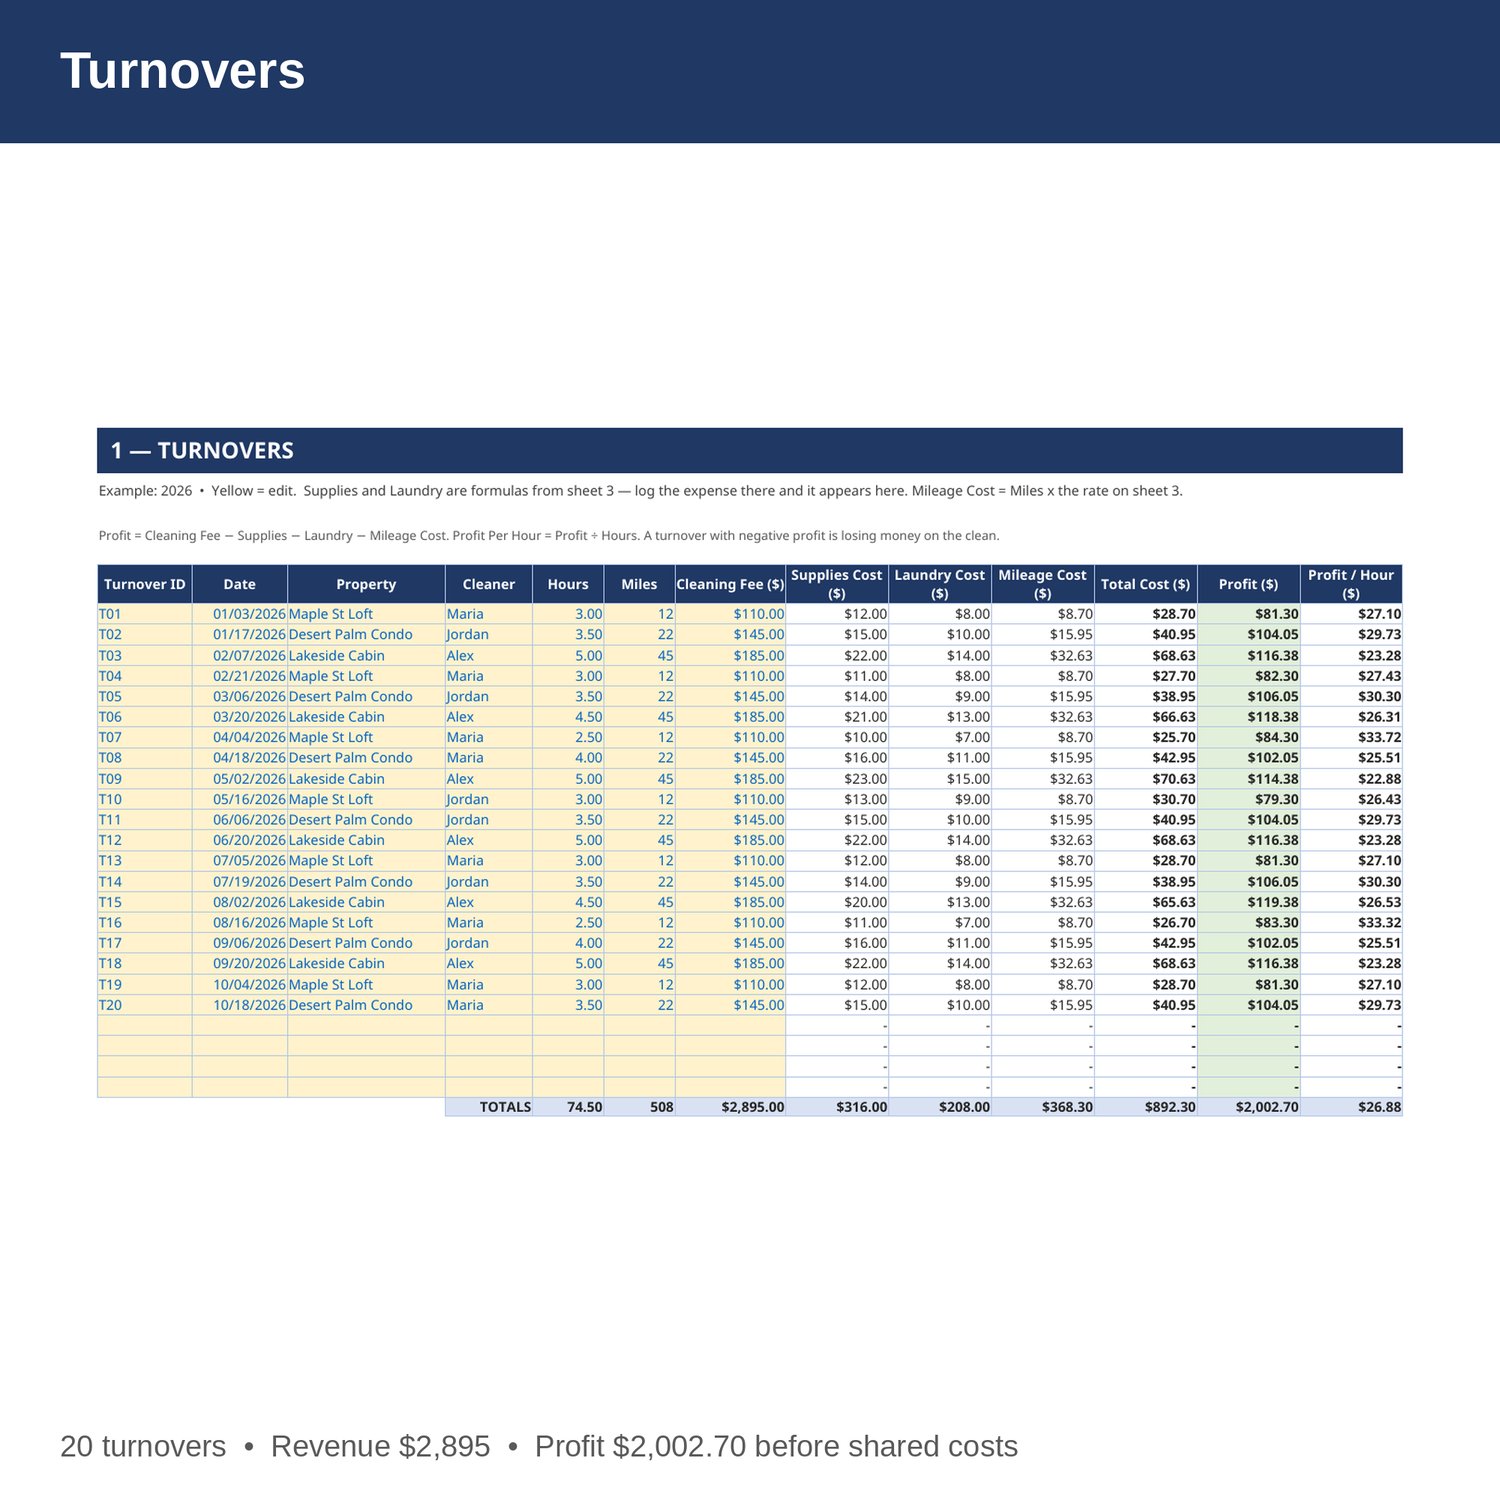
- Turnovers — every turnover: date, property, cleaner, hours, miles, and cleaning fee. Supplies and laundry costs are pulled from the Supplies and Mileage sheet by formula, mileage cost is miles times your rate, and profit and profit per hour calculate automatically. A turnover with negative profit is flagged.
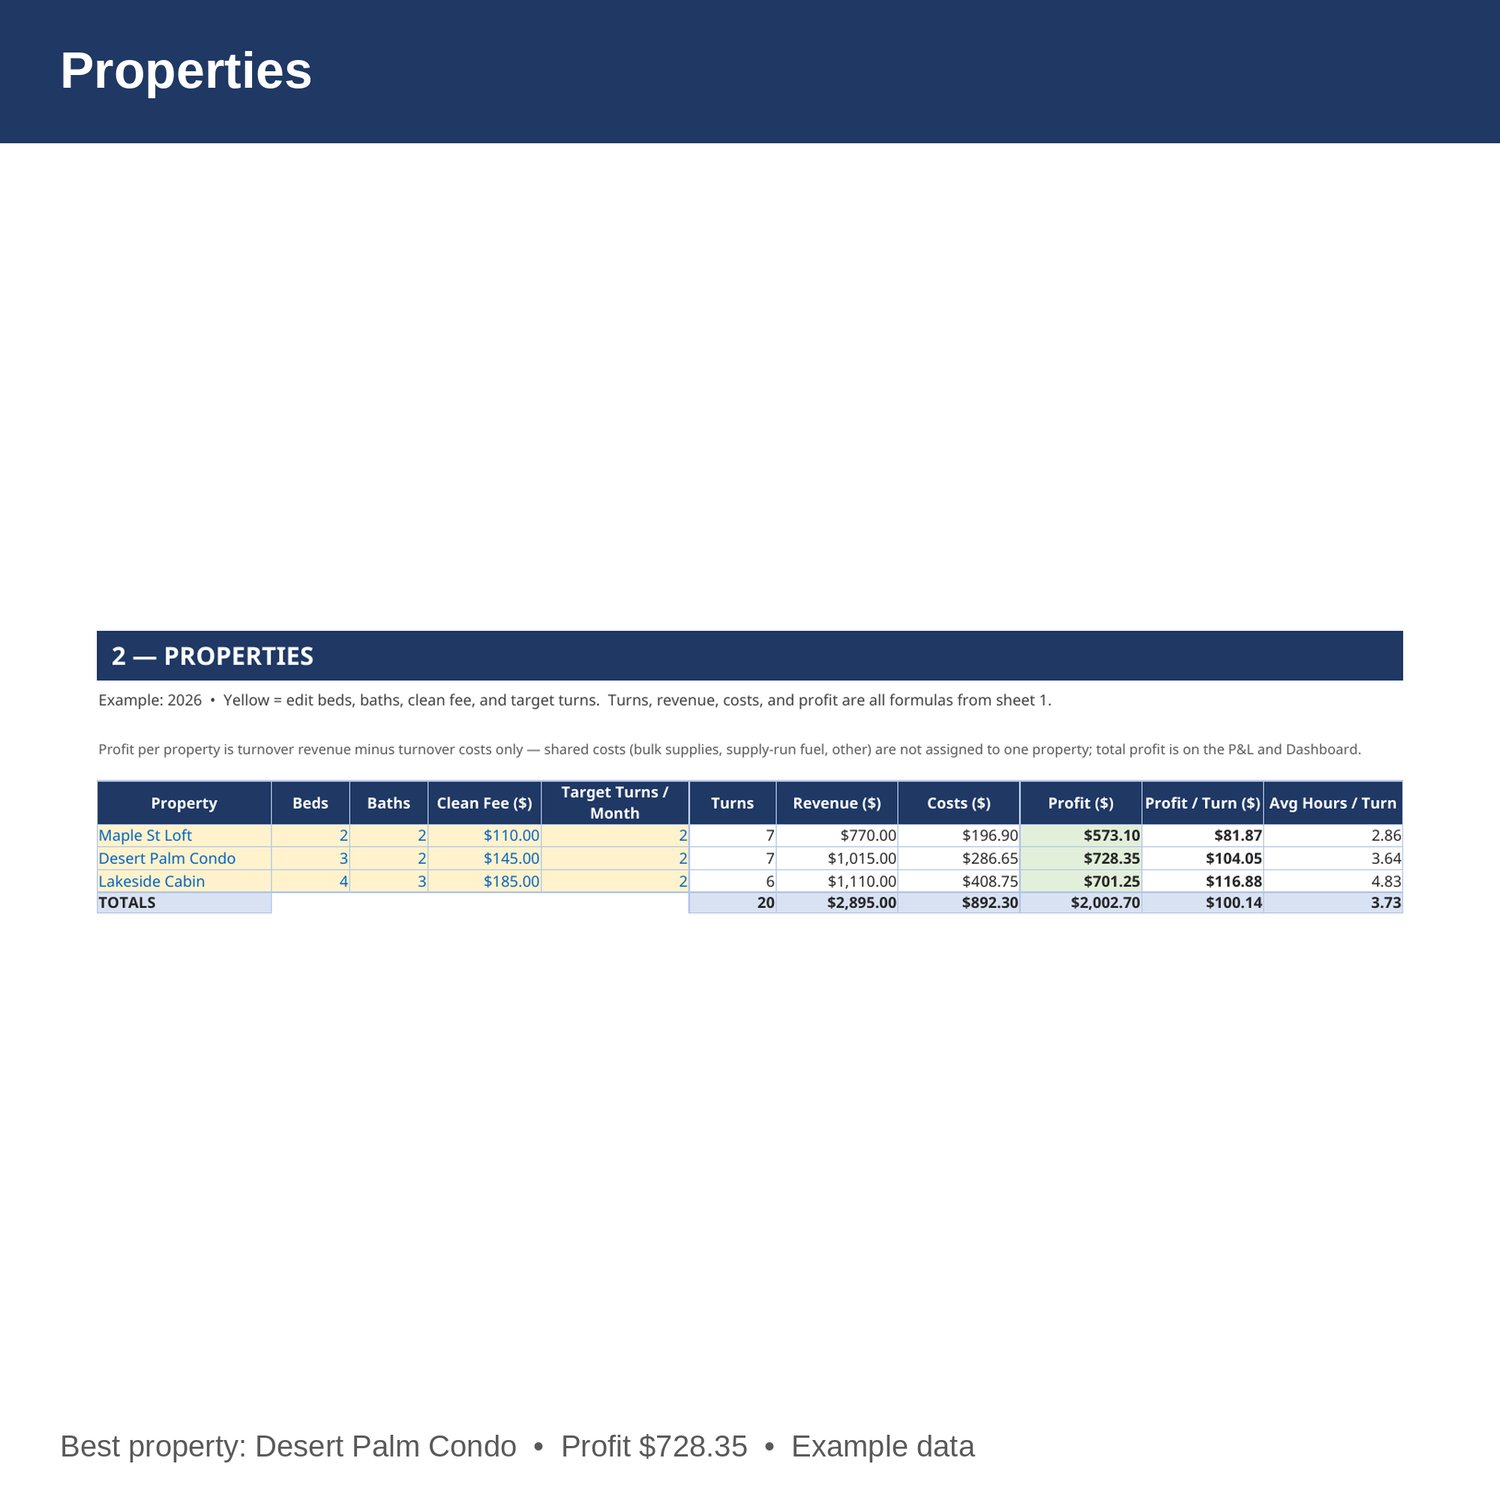
- Properties — every property: beds and baths, clean fee, target turns per month, and actual turns, revenue, costs, profit, profit per turn, and average hours per turn — all formulas from the Turnovers sheet.
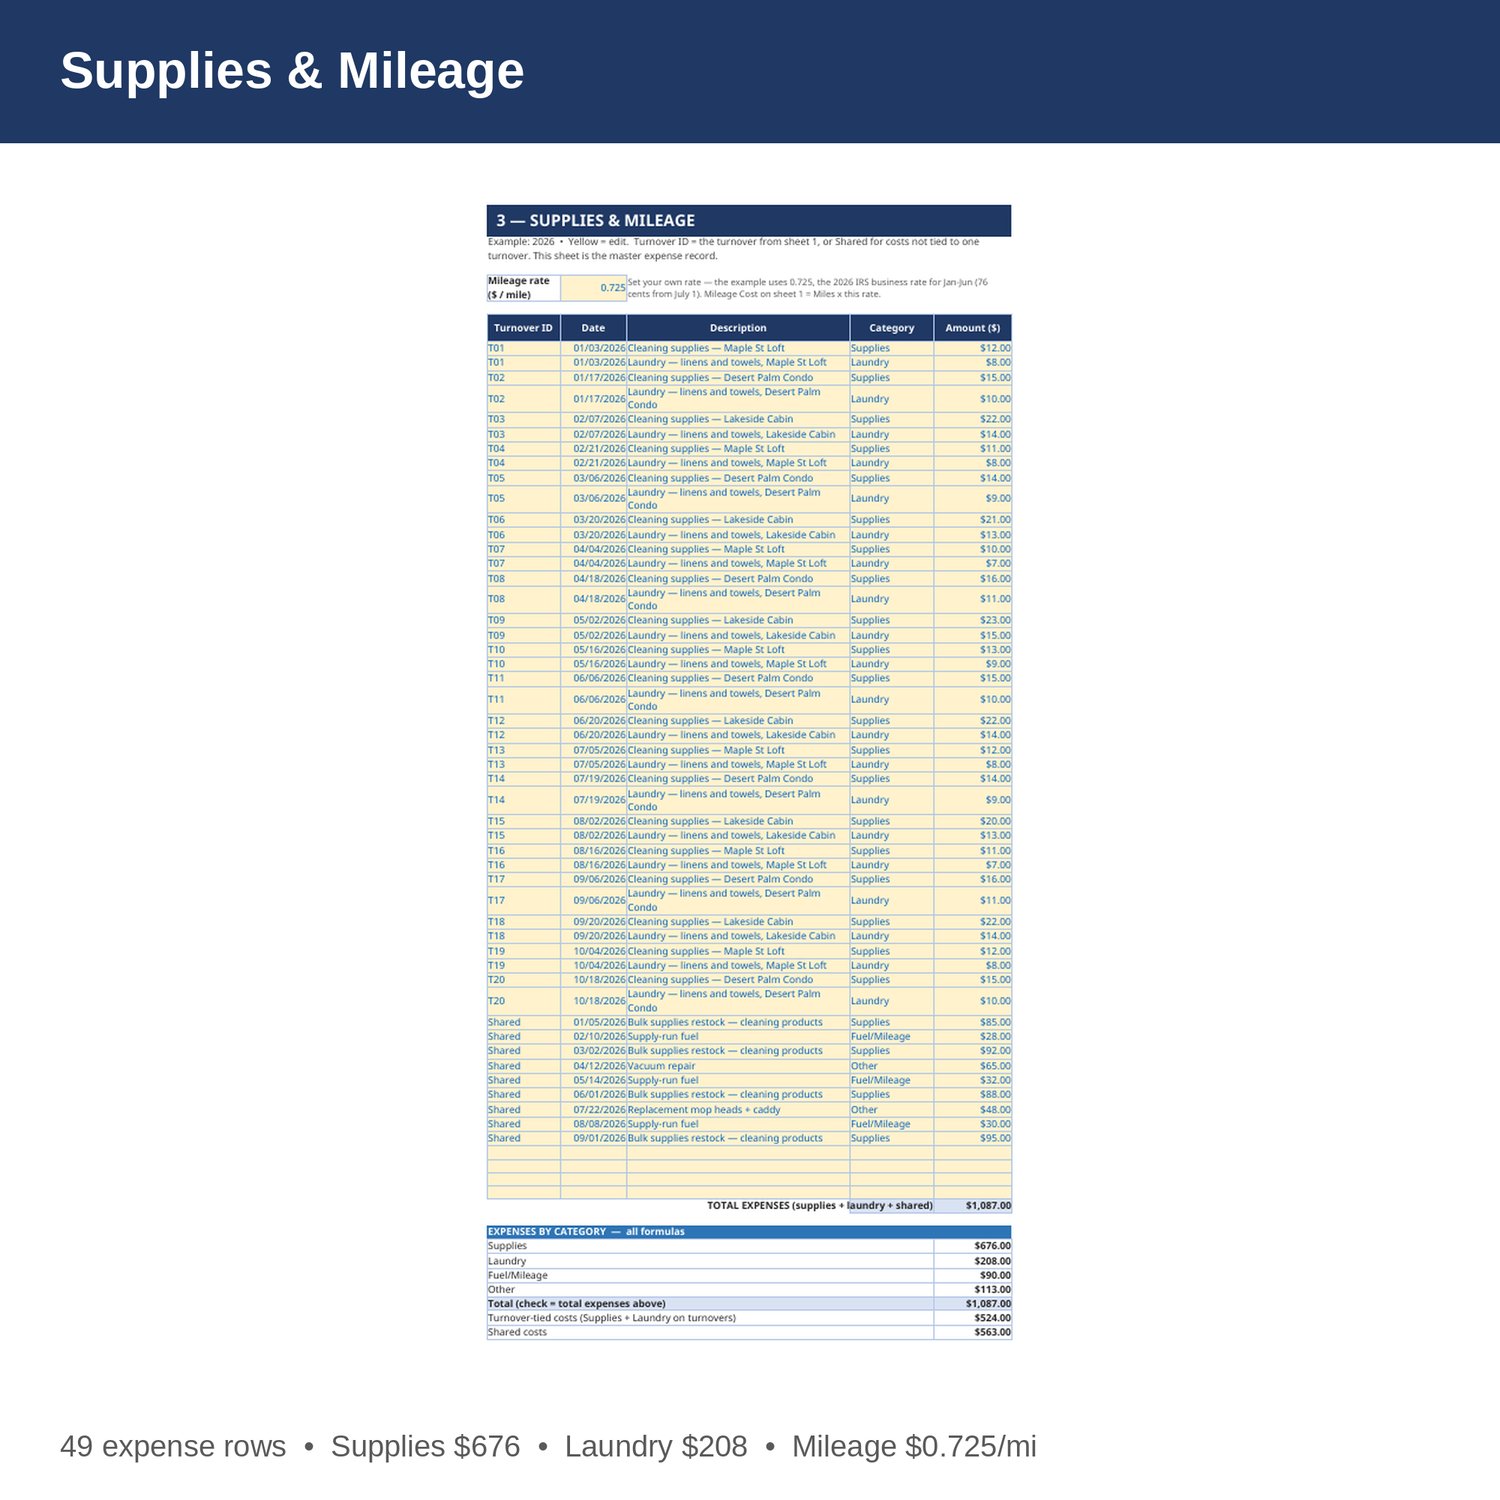
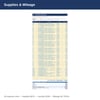
- Supplies and Mileage — every supply, laundry, fuel, and other expense, tied to a turnover or marked Shared. Set your mileage rate here. This is the master expense record — the Turnovers, P and L, and Dashboard all read from it, so nothing is counted twice.
- Monthly P and L — turnovers, hours, revenue, supplies, laundry, mileage, and shared expenses by month, Jan-Dec, with net profit, margin, and profit per hour. All formulas from sheets 1 and 3.
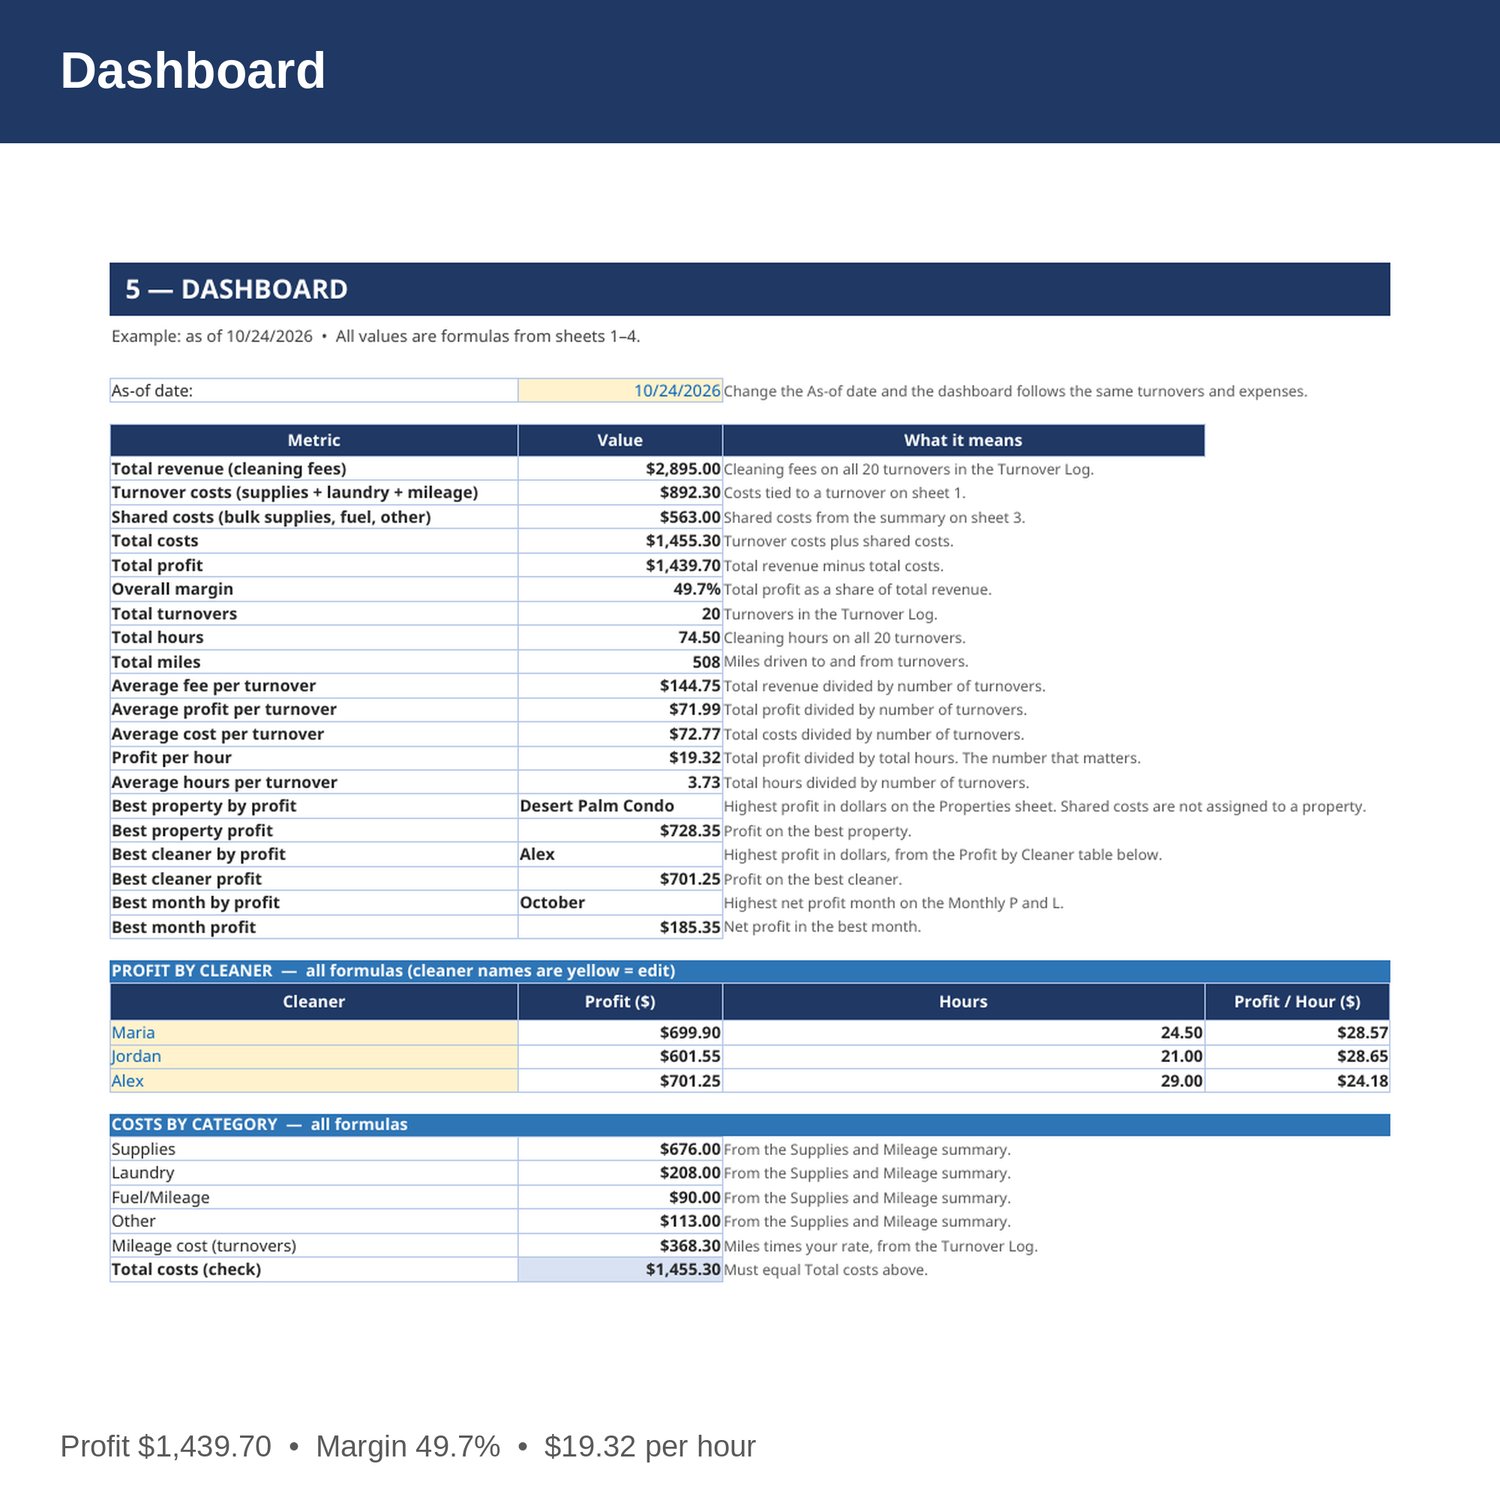
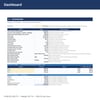
- Dashboard — total revenue, total costs, total profit and margin, profit per hour, best property, best cleaner, best month, and costs by category.
- Cover and How to Use — start here. Yellow cells are the only ones you edit.
EXAMPLE DATA (2026, 20 turnovers, Jan-Oct — replace with your own numbers):
- Total revenue 2,895 from 20 turnovers; 74.5 hours; 508 miles; average fee per turnover 144.75.
- Turnover costs 892.30 (supplies 316, laundry 208, mileage 368.30 at 0.725 per mile); shared costs 563 (bulk supplies 360, supply-run fuel 90, other 113); total costs 1,455.30; total profit 1,439.70; margin 49.7 percent; profit per hour 19.32.
- Costs by category: supplies 676, laundry 208, fuel/mileage 90, other 113, mileage cost 368.30.
- Best property: Desert Palm Condo, profit 728.35 (7 turns, 104.05 per turn). Lakeside Cabin earns the most per turn at 116.88 but costs the most in mileage, so it is second on total profit at 701.25. Maple St Loft: profit 573.10.
- Best cleaner by profit: Alex, 701.25 (6 turns, 29 hours). Maria is a close second at 699.90, and Jordan earns the most per hour at 28.65.
- Best month: October, profit 185.35. Worst month: January, profit 100.35, because of an 85 bulk supplies restock.
HOW IT WORKS:
1. Download the Excel file instantly after purchase.
2. On sheet 3, set your mileage rate in the yellow cell. The example uses 0.725 per mile, the 2026 IRS business rate for Jan-Jun (it rose to 0.76 from July 1).
3. Add a row on sheet 1 for every turnover: date, property, cleaner, hours, miles, and cleaning fee.
4. Log every expense on sheet 3 with the right Turnover ID (or Shared) and category. A turnover's profit is only right if its supplies and laundry are logged.
5. Check profit per hour on the Dashboard weekly. If a property earns less per hour than the others, its fee or its cleaner time needs a look.
HOW THE NUMBERS WORK:
Profit per turnover is the cleaning fee minus supplies minus laundry minus mileage cost. Mileage cost is miles times your rate. Total profit is total revenue minus all costs, including shared costs like bulk supplies and supply-run fuel. Profit per hour is total profit divided by total hours. Don't log a trip twice: mileage cost on sheet 1 already covers driving to and from a turnover at your rate, so log fuel or supply-run trips on sheet 3 as Shared only when they are not part of a turnover's miles.
WHO IT'S FOR:
Airbnb and short-term rental hosts, co-hosts, and cleaning teams who want clean per-turnover books and a profit-per-hour number they can trust before they set the next cleaning fee.
PLEASE NOTE:
- This is a digital download. No physical item will be shipped.
- Works in Microsoft Excel and Google Sheets (upload to Google Drive to open in Sheets).
- Example data for 2026 is included (20 turnovers, 49 expense rows, Jan-Oct, 3 properties, 3 cleaners). Replace it with your own numbers.
- This is a bookkeeping and planning tool only, not tax, legal, or CPA advice. Confirm tax and legal decisions with your own accountant or CPA.
- Due to the nature of digital downloads, refunds are not available. Message me before buying if you have a question.
Built by an accountant: B.S. Accountancy, ASU W. P. Carey, with revenue-reconciliation experience at Marriott and audit work at PwC.