
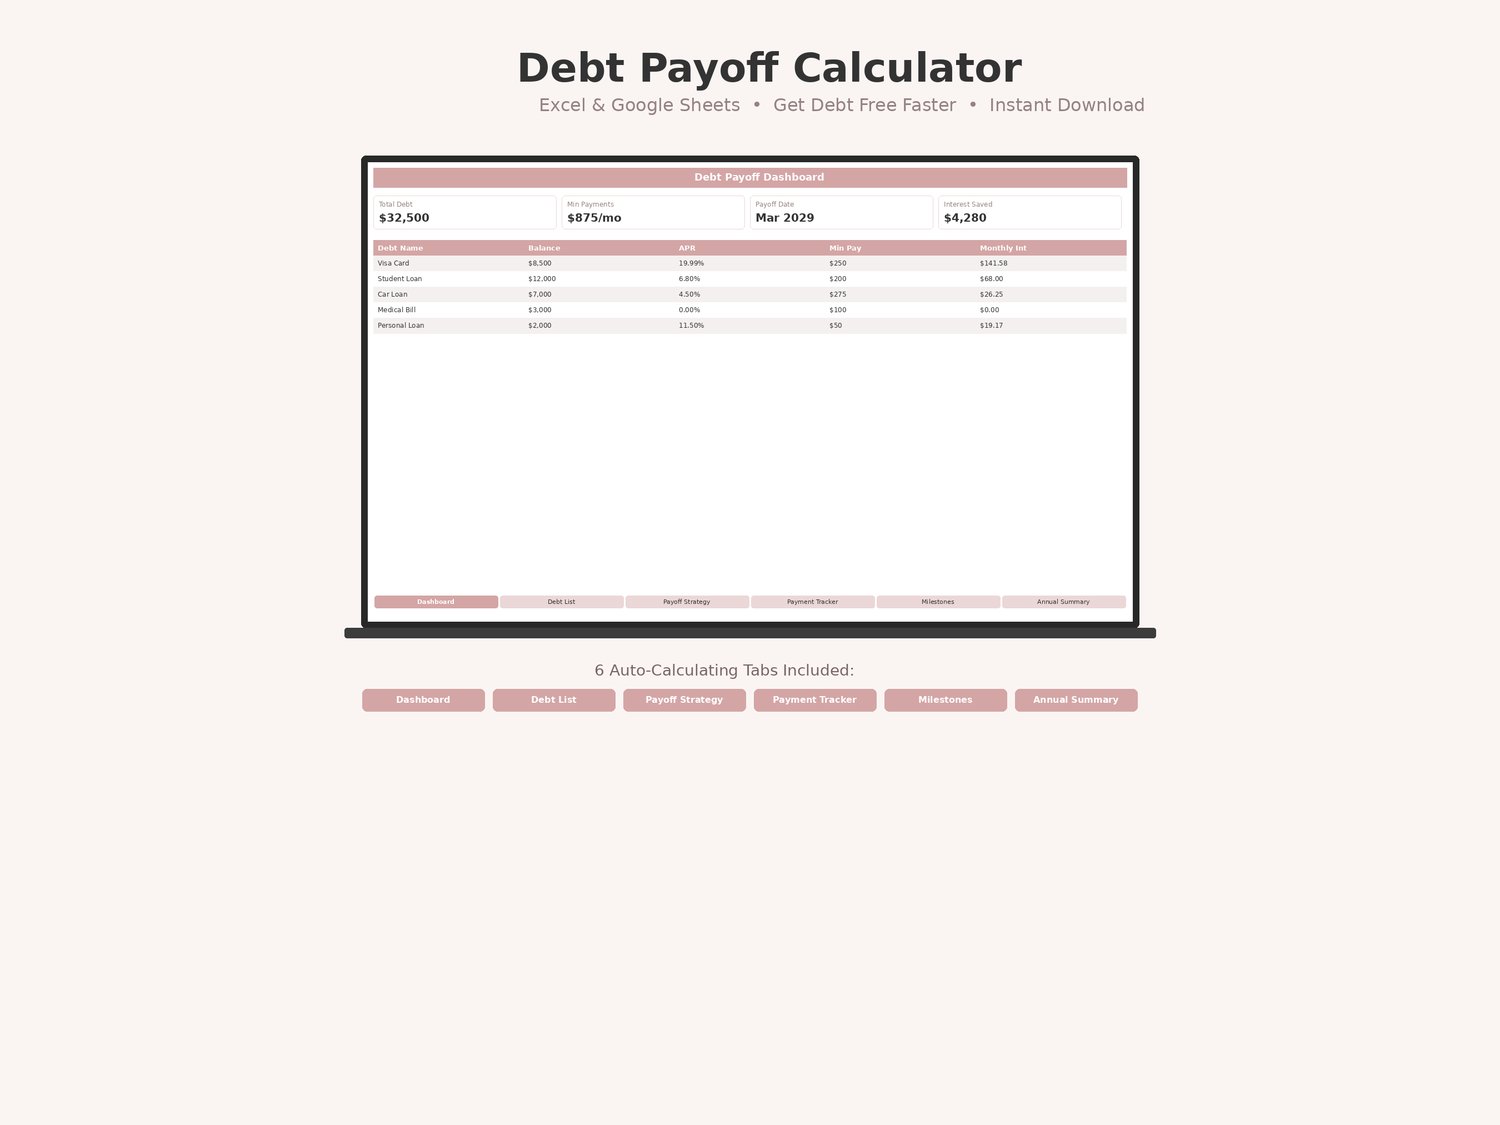


Debt Payoff Calculator — Avalanche & Snowball Planner for Excel & Google Sheets
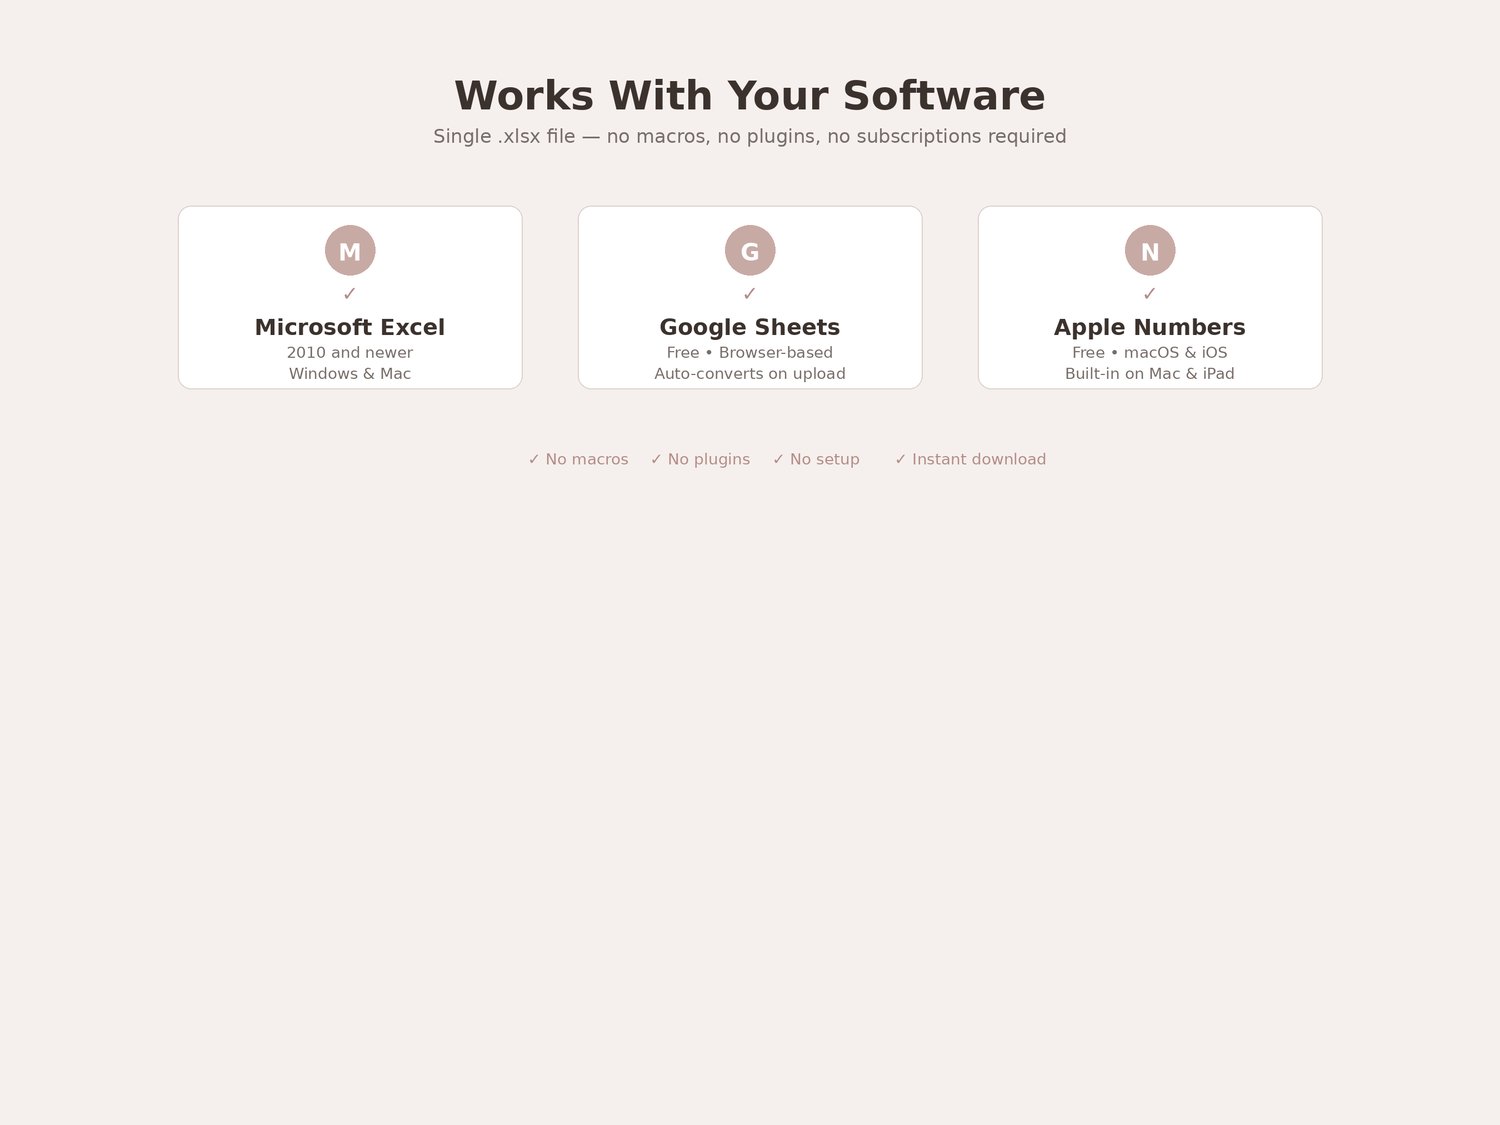
A 6-tab auto-calculating spreadsheet for planning and tracking debt repayment. Compare avalanche and snowball strategies, track every payment, and watch your balances drop to zero. Works instantly in Microsoft Excel, Google Sheets, and Apple Numbers.
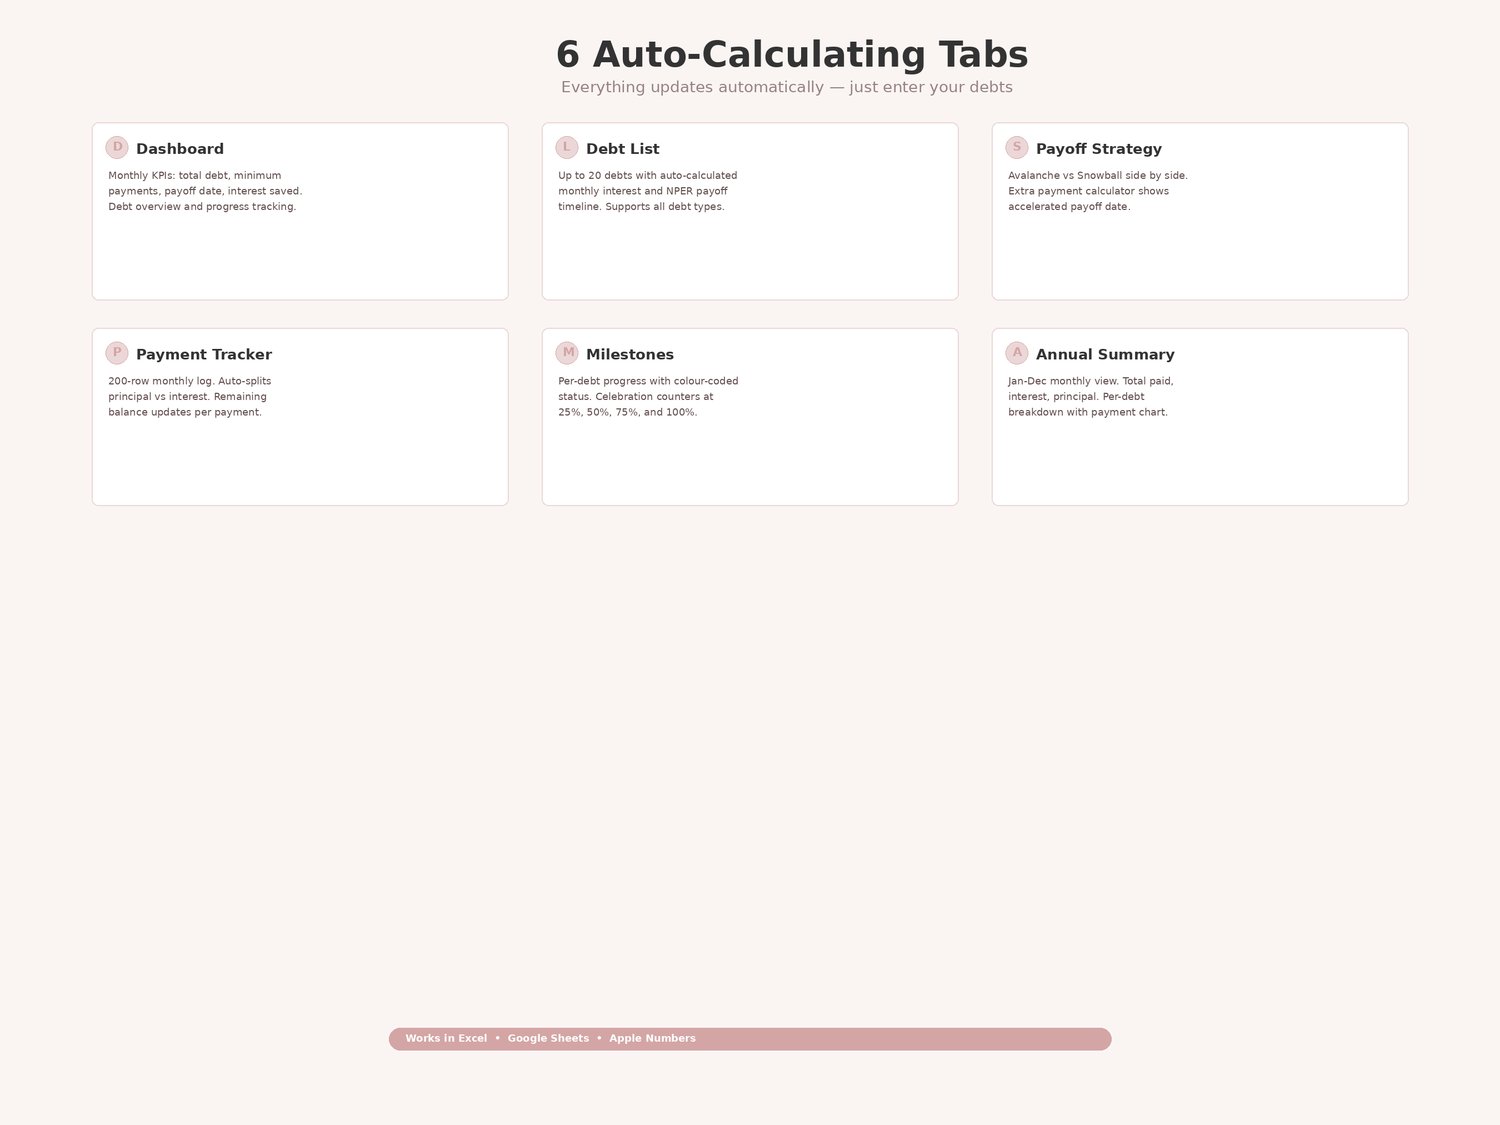
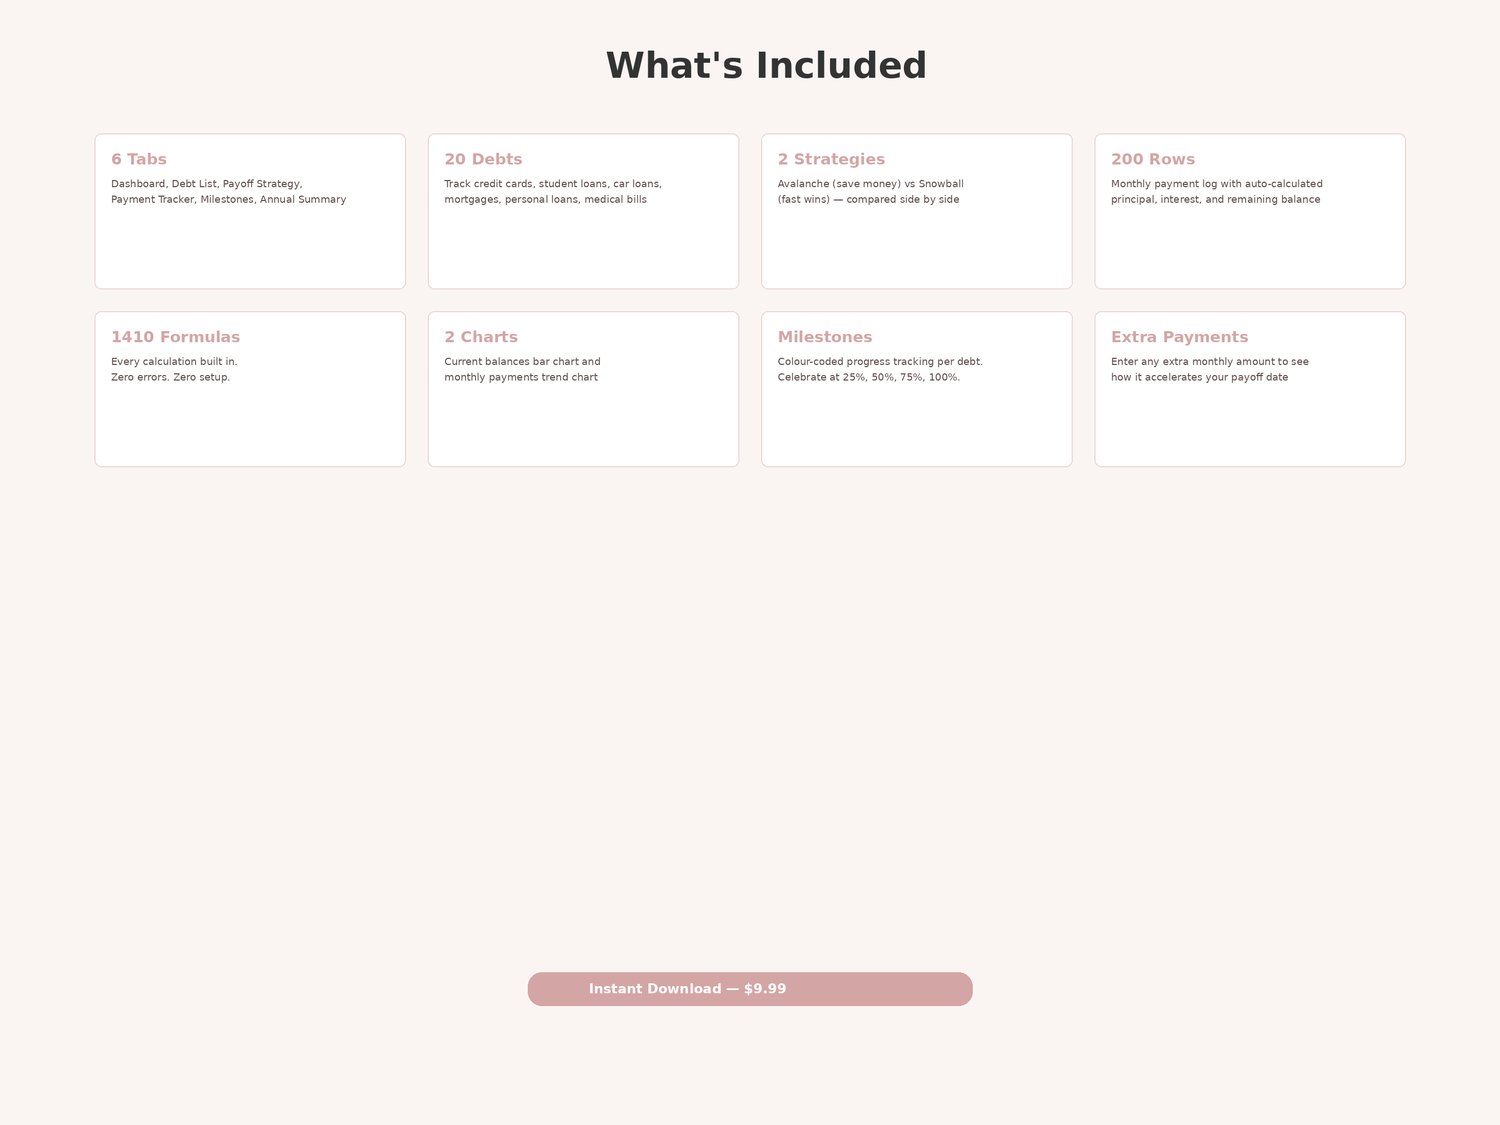
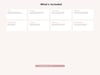
What's inside:
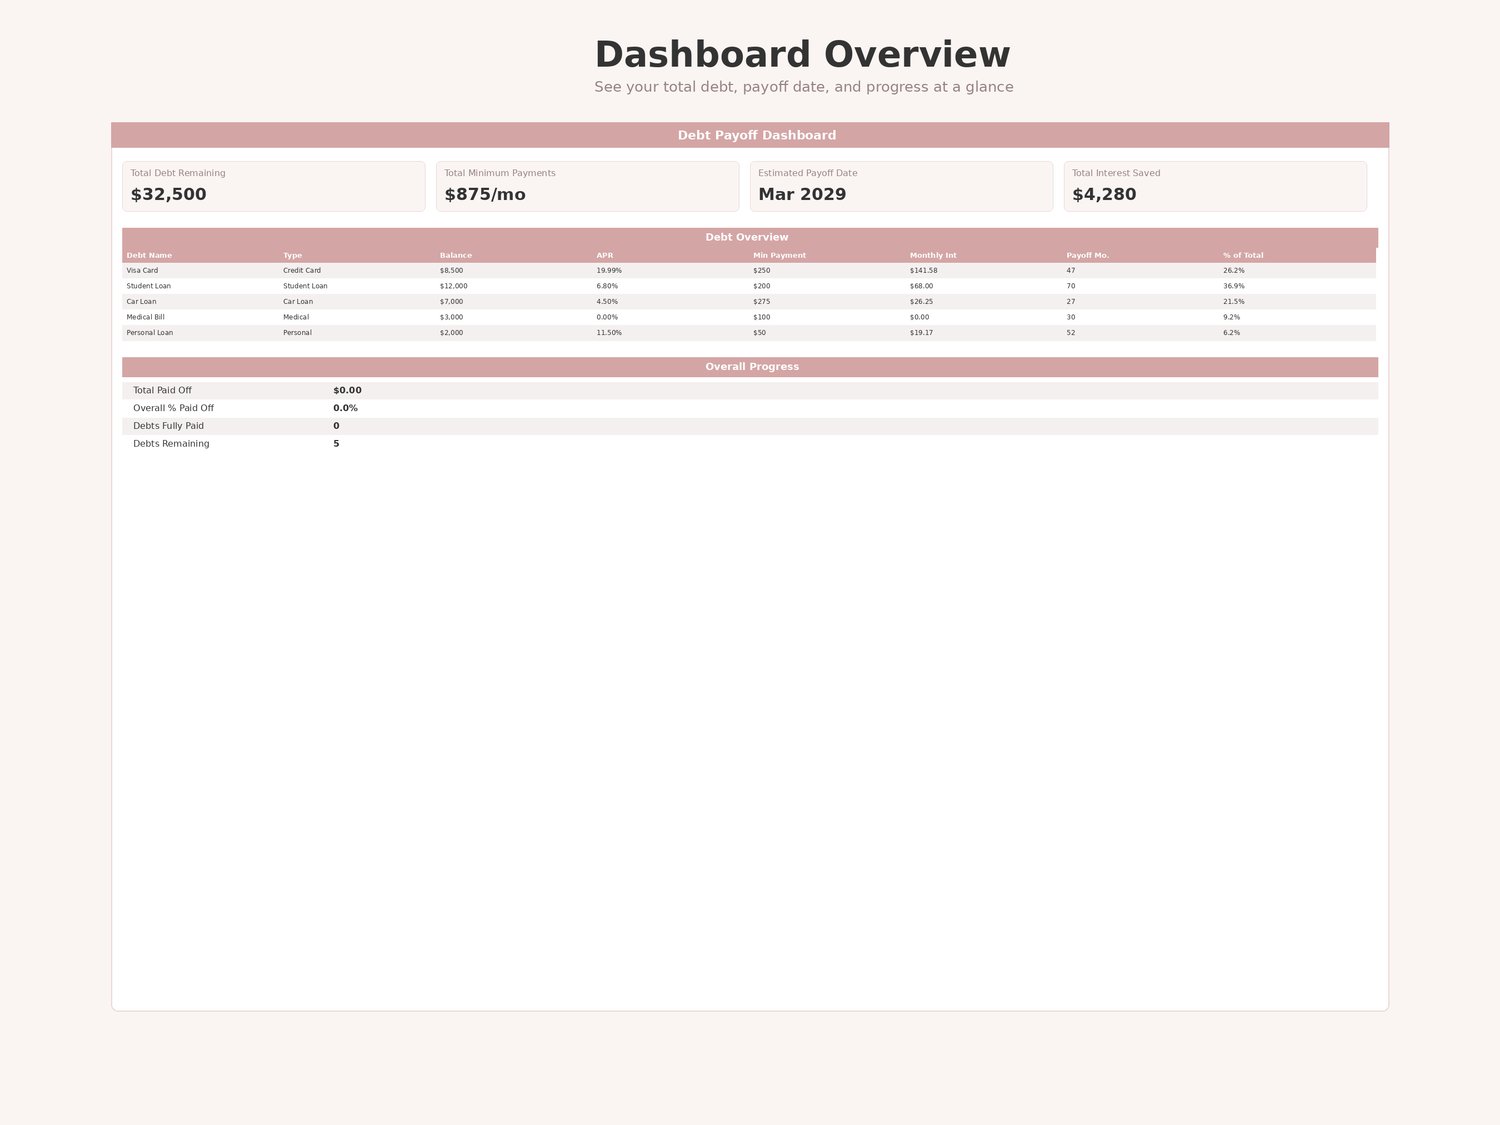
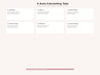
Tab 1 — Dashboard: at-a-glance overview with four KPI cards (Total Debt Remaining, Total Minimum Payments, Estimated Payoff Date, Total Interest Saved), a debt overview table listing every debt with its balance, APR, monthly interest, and payoff timeline, an overall progress section with total paid off and debts remaining, and a current balances bar chart. Every cell auto-calculates.
Tab 2 — Debt List: main input tab for up to 20 debts. Enter each debt's name, type (Credit Card, Student Loan, Car Loan, Mortgage, Personal Loan, Medical, Other), current balance, interest rate (APR), minimum payment, and due date. Monthly Interest auto-calculates as Balance × (APR/12). Payoff Months auto-calculates using NPER. Total row sums balances, minimums, and monthly interest.
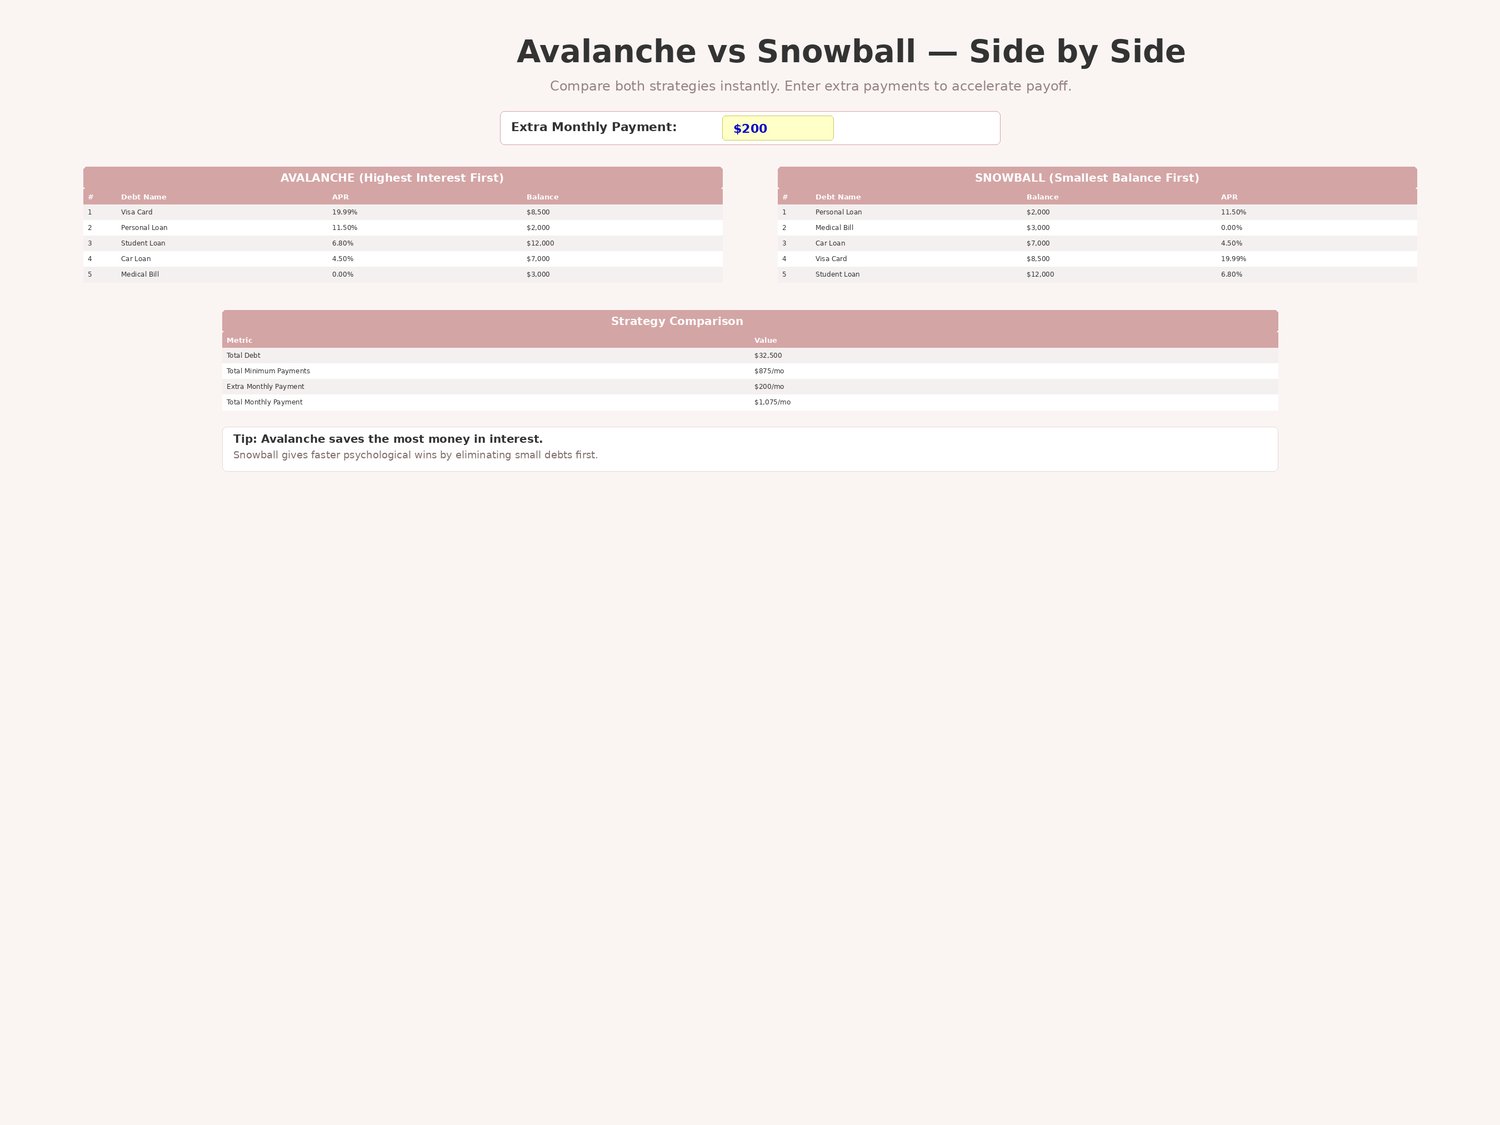
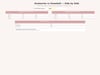
Tab 3 — Payoff Strategy: side-by-side comparison of Avalanche (highest interest first — saves the most money) and Snowball (smallest balance first — fastest psychological wins). Enter an extra monthly payment amount to see how additional money accelerates your payoff. Strategy Comparison section shows total debt, total payments, estimated interest, and interest saved.
Tab 4 — Payment Tracker: monthly log with 200 rows. Record each payment with date, debt name, and amount paid. Principal Paid, Interest Paid, and Remaining Balance auto-calculate for every row. See exactly how each payment splits between principal and interest.
Tab 5 — Milestones: visual progress for every debt. Starting balance, current balance, amount paid off, percentage paid off, target date, and auto-generated status text ("Just started" → "Making progress" → "Halfway!" → "Almost there!" → "DEBT FREE!"). Colour-coded: green ≥75%, yellow 50–75%, red <50%. Celebration Milestones counter at the bottom: debts at 25%+, 50%+, 75%+, 100%.
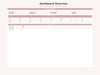
Tab 6 — Annual Summary: full-year view with monthly columns (Jan–Dec + Total). Total Debt Remaining, Total Paid, Interest Paid, Principal Paid. Per-debt breakdown showing every payment logged throughout the year. Grand Total row. Monthly Payments bar chart.
No macros, no plugins. Open the file and start entering your debts. Two built-in charts and colour-coded formatting surface what matters so nothing gets missed.