

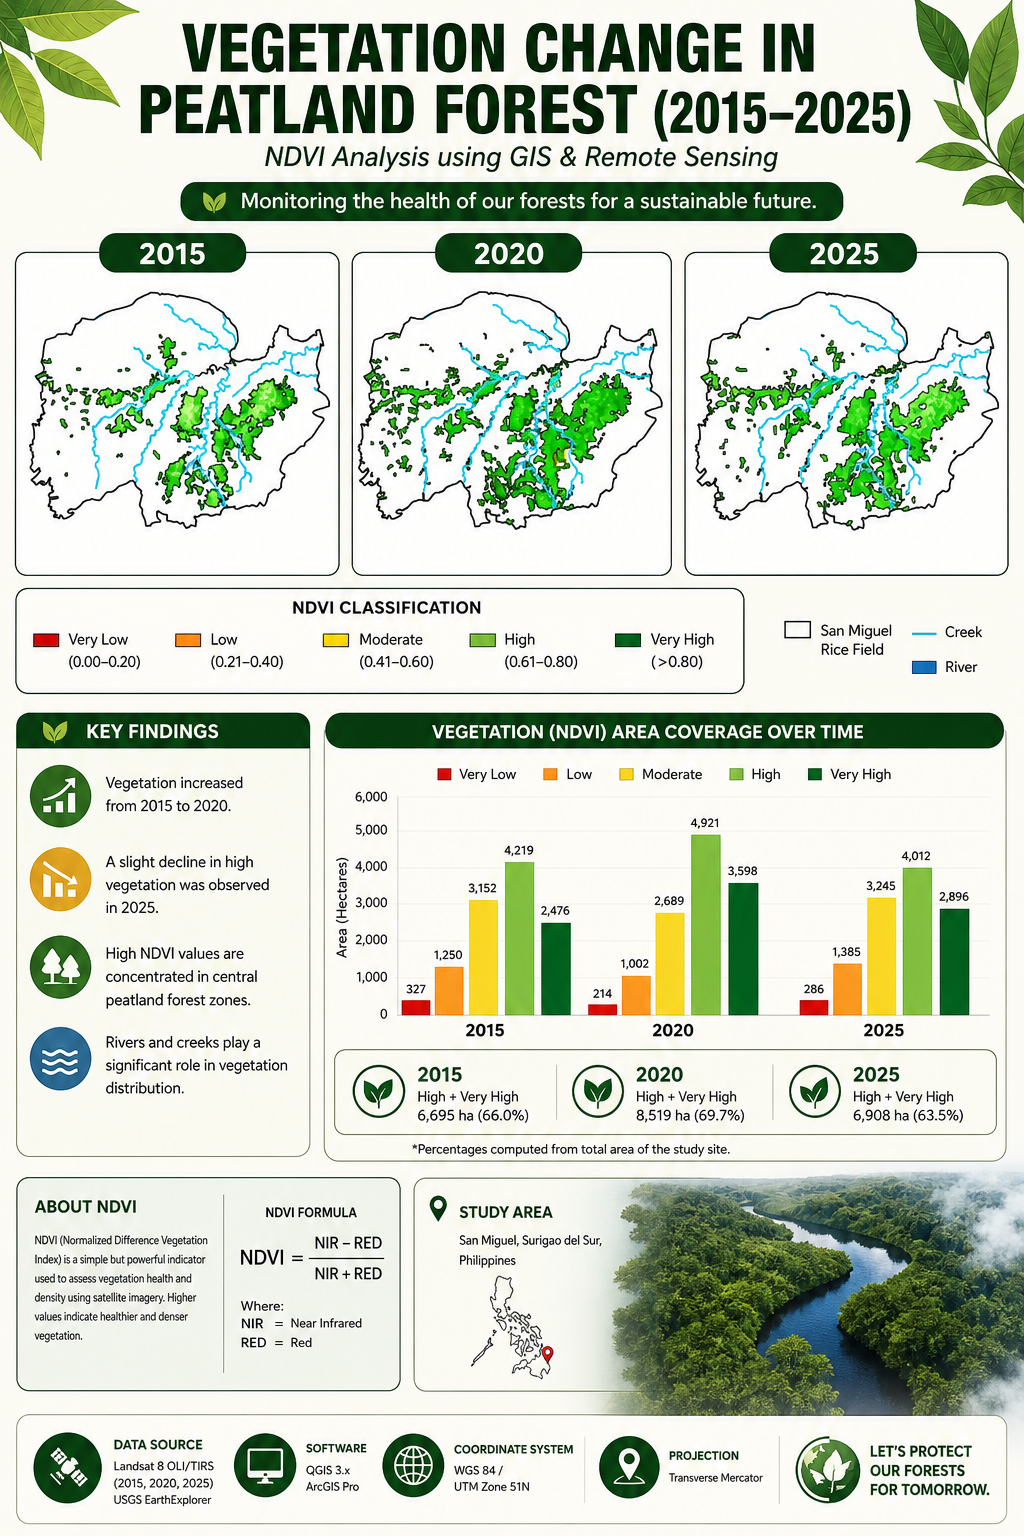
NDVI Vegetation Change Infographic (2015–2025) Peatland Forest Analysis using GIS & Remote Sensing
Understanding vegetation change has never been this simple.
This professionally designed infographic presents a clear and visually engaging analysis of vegetation dynamics in a peatland forest landscape from 2015 to 2025 using the Normalized Difference Vegetation Index (NDVI). Built using GIS and remote sensing techniques, this product transforms complex spatial data into an easy-to-understand visual story.
The infographic highlights key trends in vegetation health over time, showing areas of improvement, decline, and stability. It is perfect for students, researchers, educators, and environmental professionals who want a quick yet reliable reference for NDVI interpretation and landscape analysis.
Designed for both academic and practical use, this product can be used in research presentations, thesis defense, reports, teaching materials, and environmental awareness campaigns.
Need Help? Contact me via email: ecoresearchhub27@gmail.com