
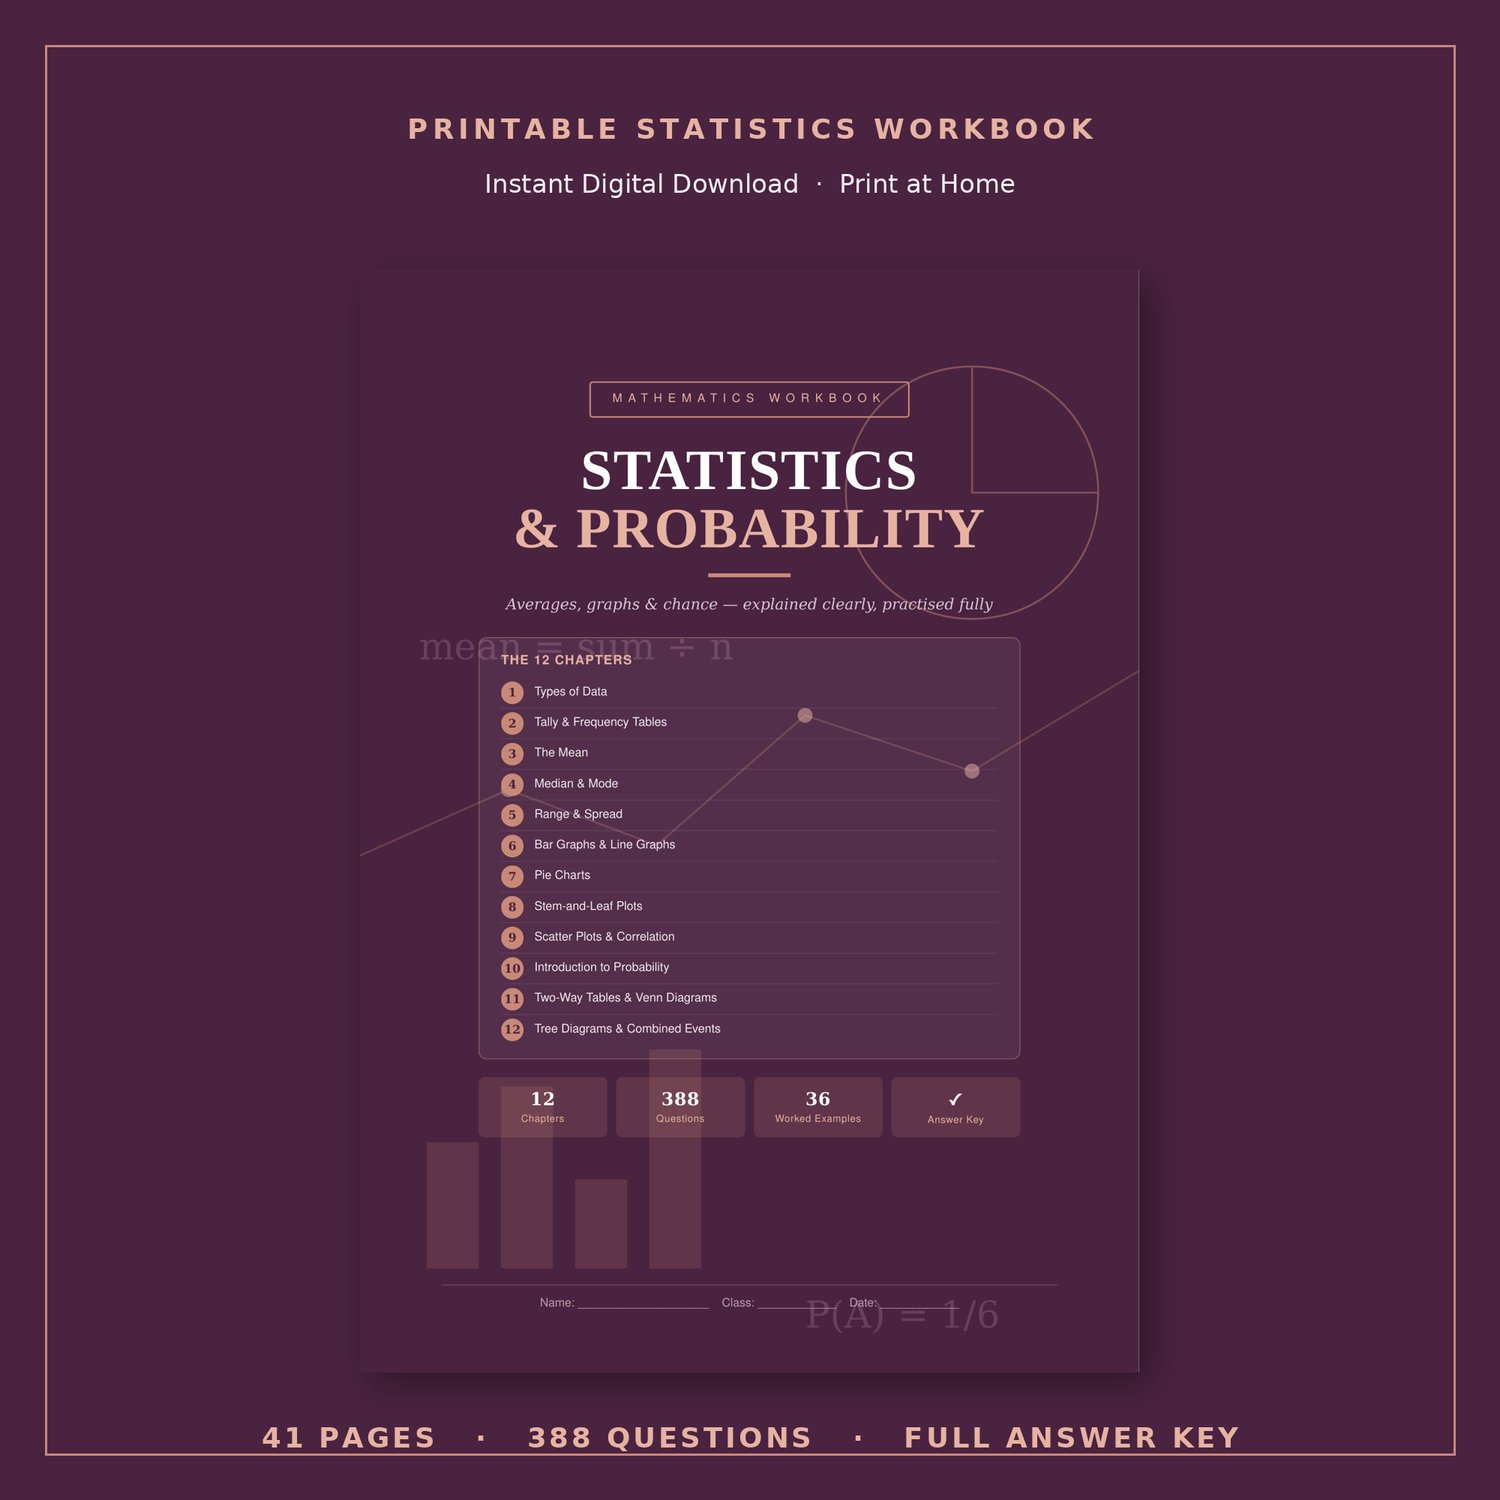
Statistics and Probability Workbook with Answer Key - 388 Questions, Year 7-11 Maths
Statistics and probability with real graphs - not boxes where a graph should be.
This 41-page printable workbook is the longest in the series, because statistics needs the diagrams. Every chart in here is drawn properly, so students read actual data rather than a placeholder.
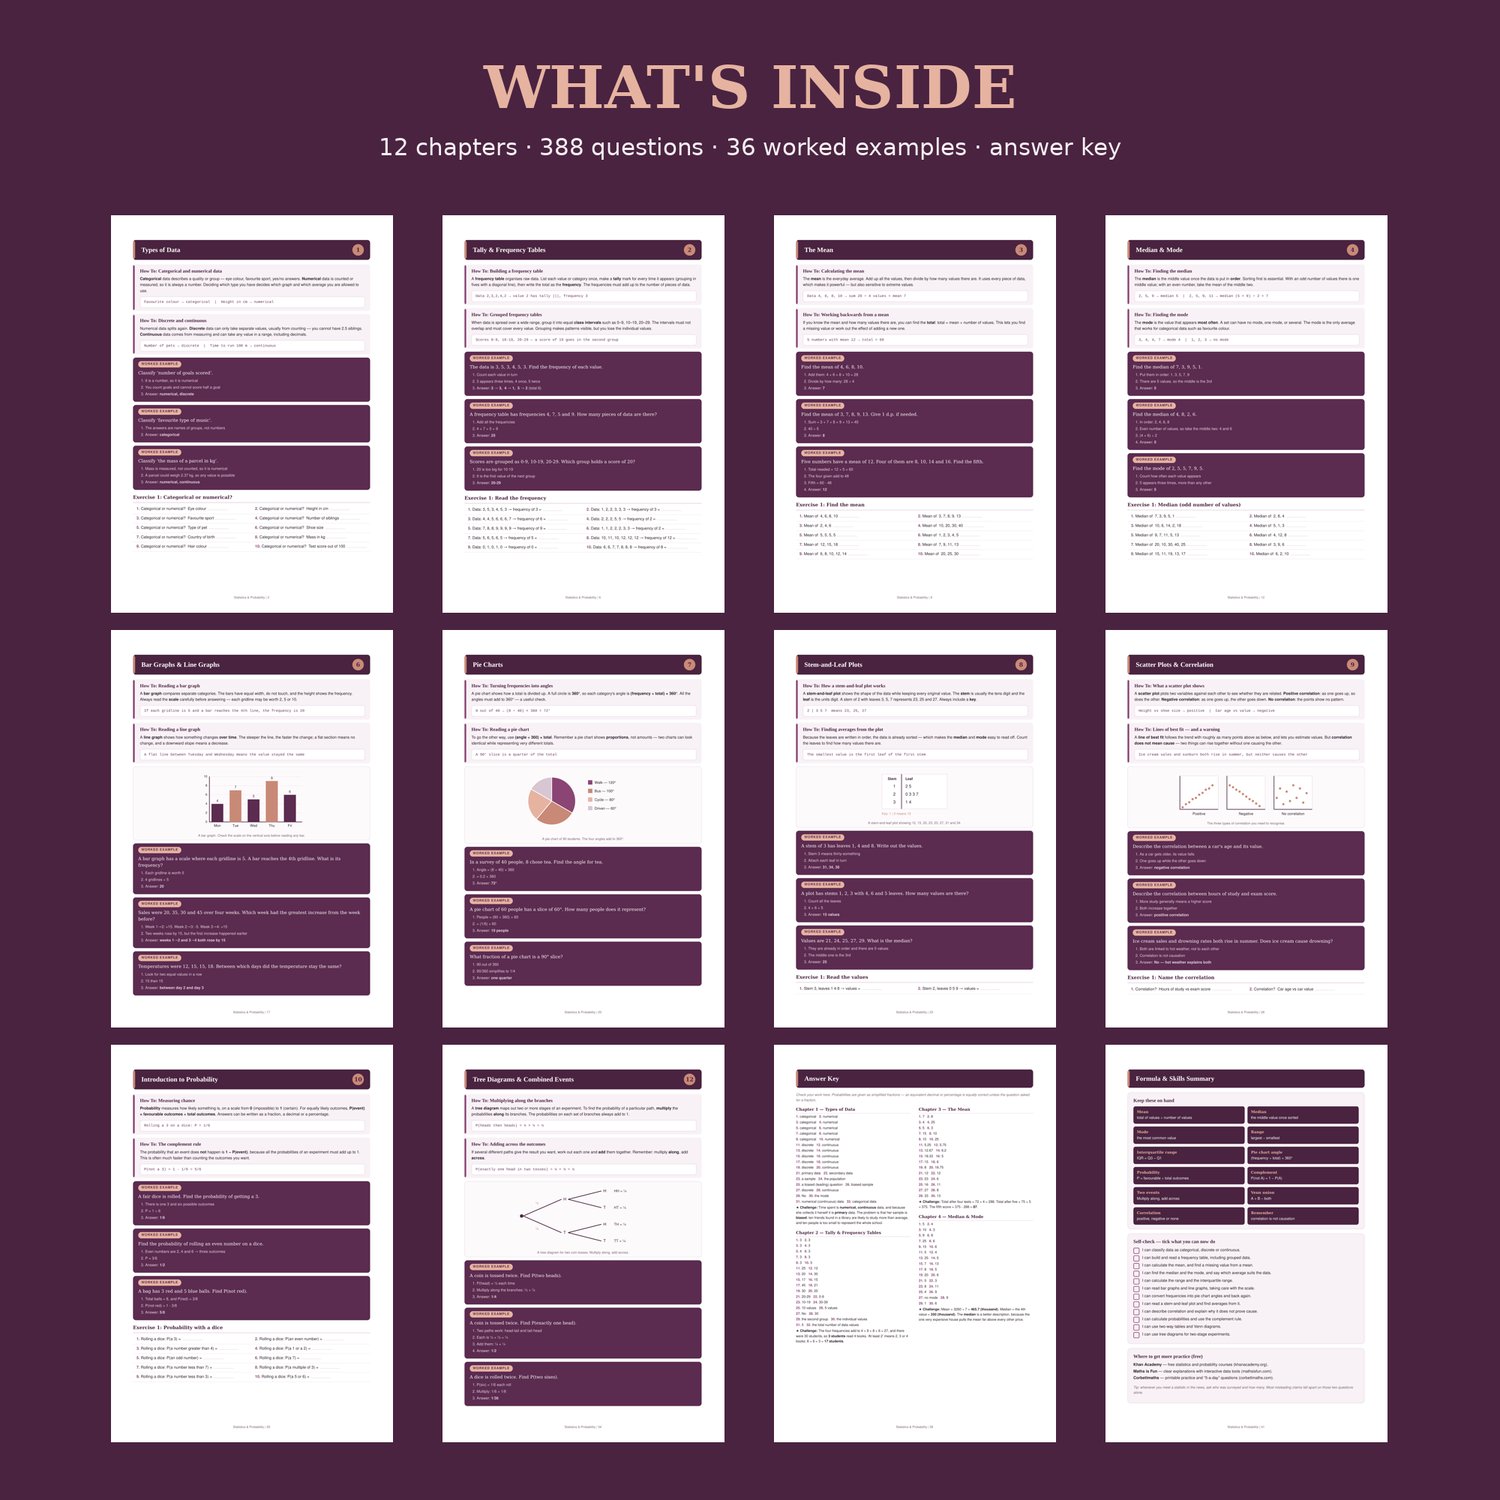
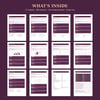
WHAT'S INSIDE
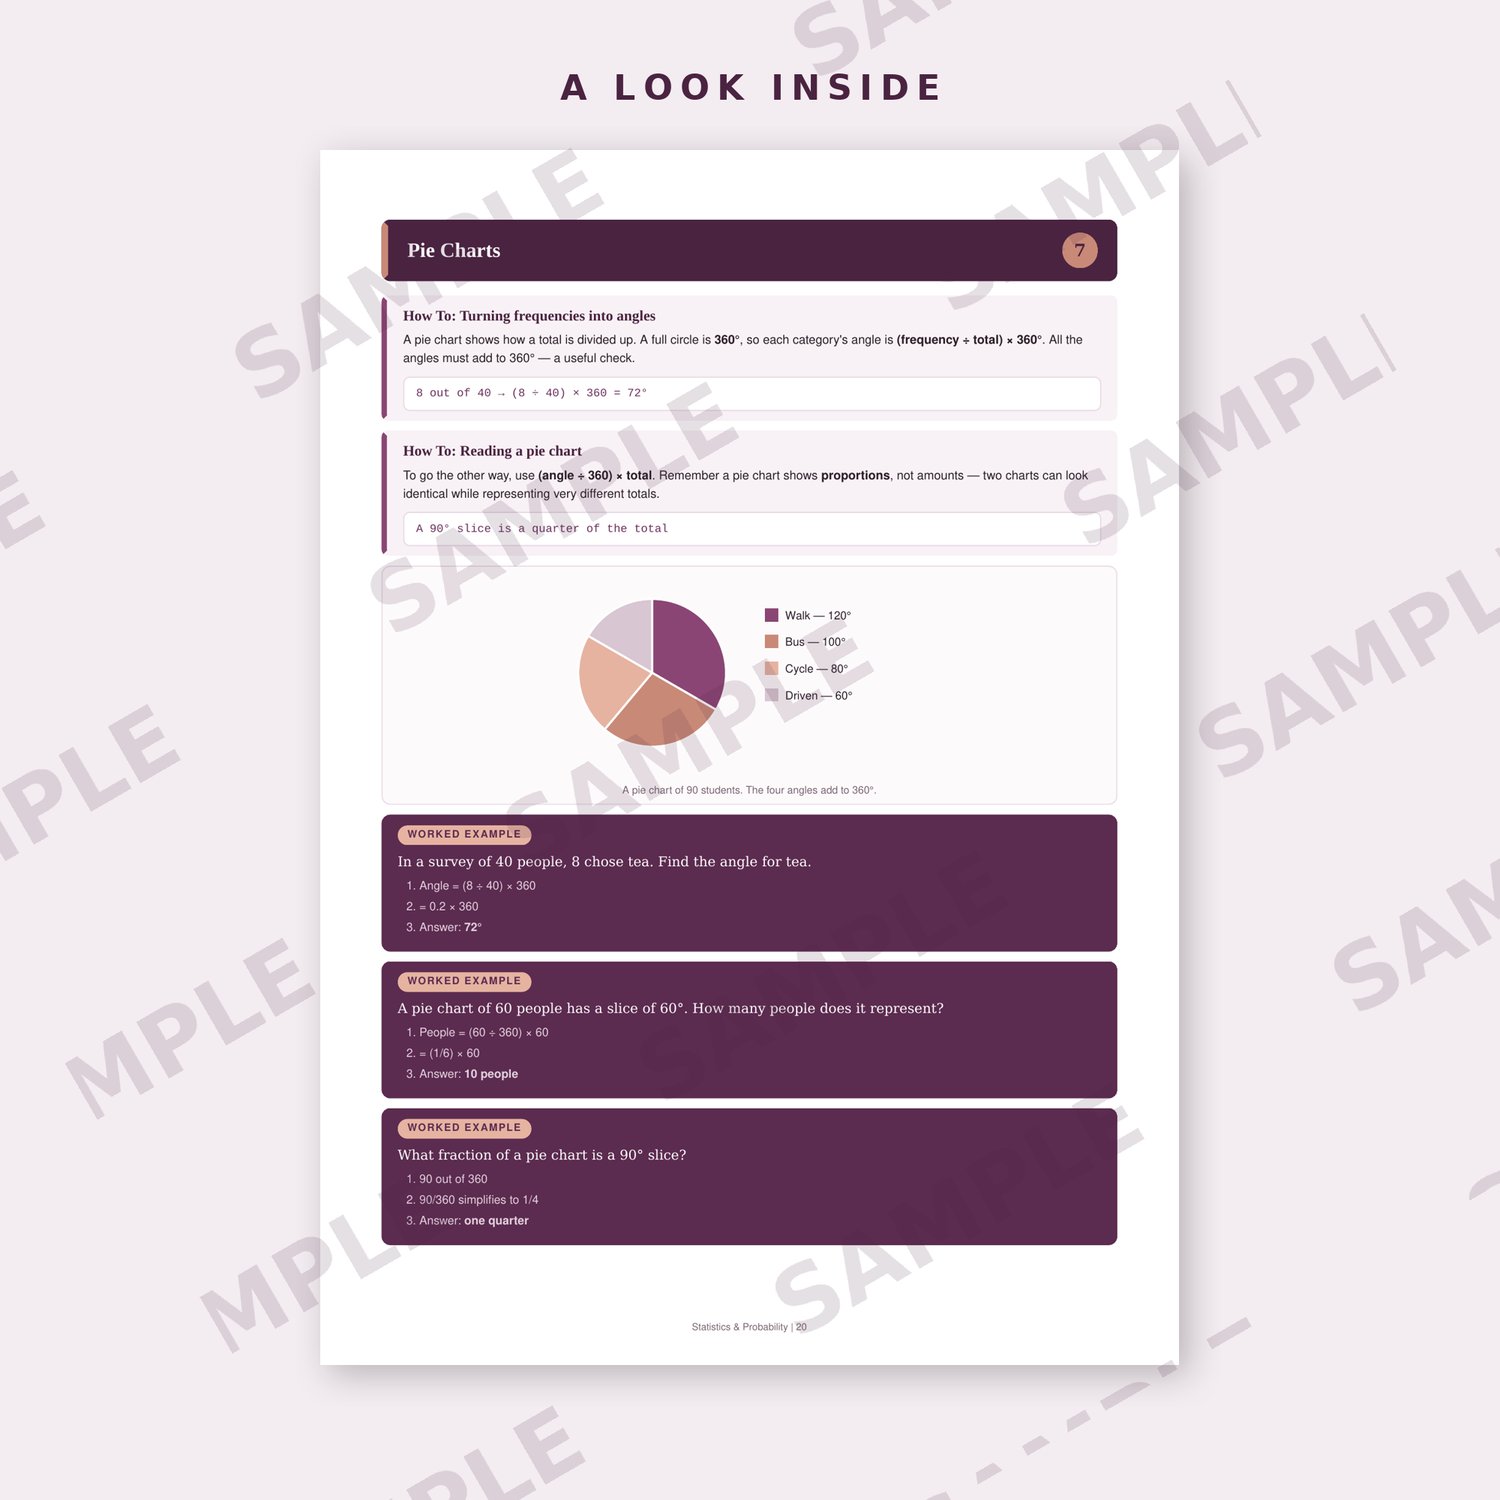
12 chapters, each opening with two plain-English "How To" guides
36 fully worked examples with numbered steps
388 practice questions with space to work
12 challenge problems with solving tips
A 20-question mixed practice test
A complete answer key and skills summary
THE 12 CHAPTERS
Types of Data · Tally and Frequency Tables · The Mean · Median and Mode · Range and Spread · Bar and Line Graphs · Pie Charts · Stem-and-Leaf Plots · Scatter Plots and Correlation · Introduction to Probability · Two-Way Tables and Venn Diagrams · Tree Diagrams
EVERY ANSWER CHECKED
Averages and probability are easy to get subtly wrong in an answer key. Every answer here has been verified programmatically against its question before publishing.
THE DIAGRAMS
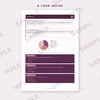
A real bar graph, a pie chart with legend, a stem-and-leaf plot, three scatter plots showing positive, negative and no correlation, a Venn diagram and a tree diagram.
WHO IT SUITS
Year 8-11 (Grade 7-10). Students revising for GCSE, NCEA or equivalent, teachers wanting ready-made statistics practice, tutors and homeschooling families. The answer key sits at the back, so you can print the student pages on their own.
WHAT YOU GET
Instant download - a print-ready A4 PDF. Print as many copies as you need for your own classroom or family. Spelling is "maths" throughout.
HOW THIS WORKBOOK WAS MADE
I design the structure, curriculum sequence and house format for every workbook, and use software tools - including AI assistance - to help generate and typeset the practice questions and diagrams. Every answer is then checked programmatically against the question before publishing.