Time Pivot π/4 Projector
Time Pivot π/4 Projector is a specialized market-cycle research tool designed to project future dates and times directly from significant SPX pivot prices using multiples of π/4.
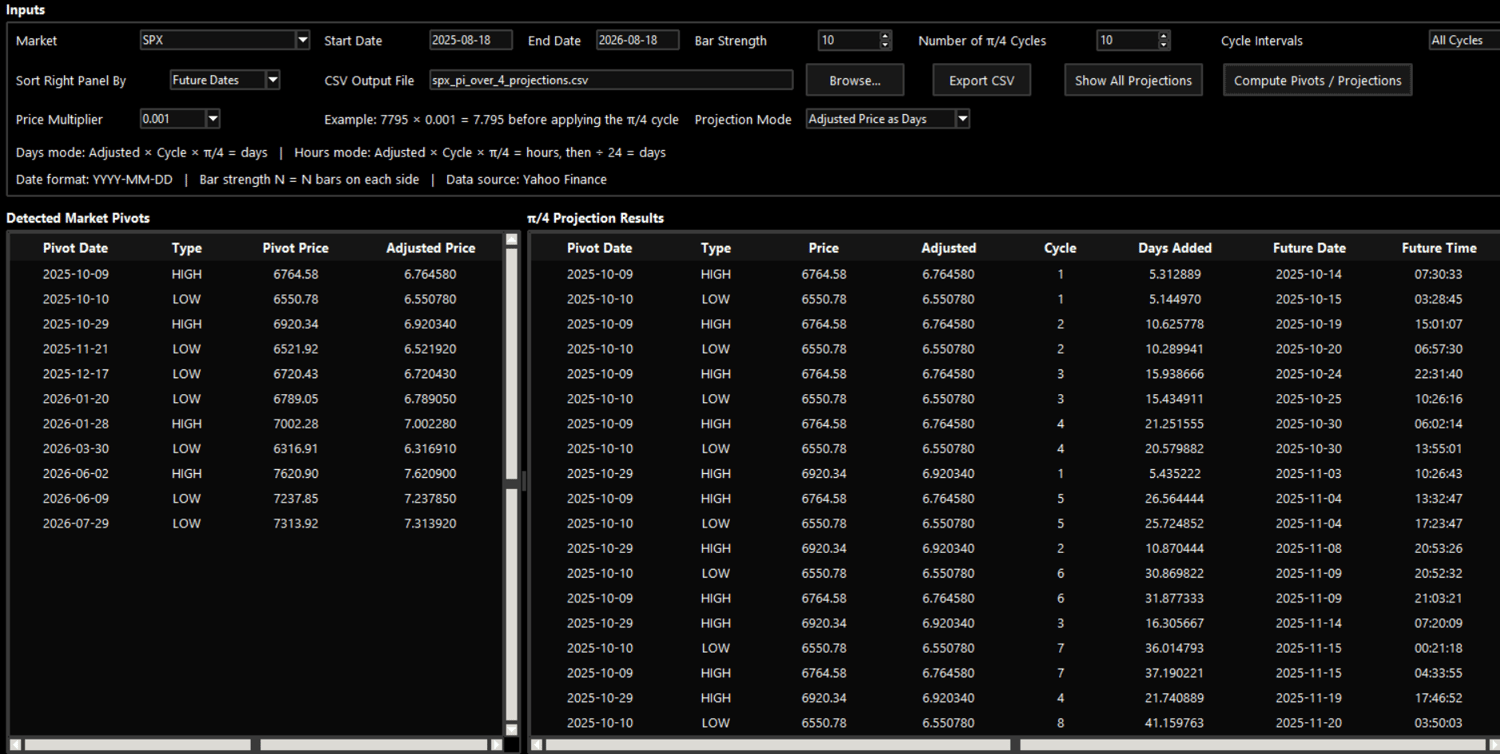
The application analyzes SPX cash market daily data, identifies important pivot highs and lows within a selected date range, and converts each pivot price using a user-selected price multiplier. The adjusted pivot price is then combined with successive π/4 cycle intervals to calculate future projected market dates.
The program provides two independent projection methods. In the first mode, the adjusted pivot price is treated directly as calendar days. In the second mode, the adjusted pivot price is treated as hours, multiplied by the selected π/4 interval, and then divided by 24 to convert the result into projected calendar days.
For example, if an SPX pivot occurs at 7795 and the user selects a price multiplier of 0.001, the adjusted pivot price becomes 7.795. The program can then multiply 7.795 by each selected π/4 cycle and interpret the resulting value either as calendar days or as hours before converting the result into a future date.
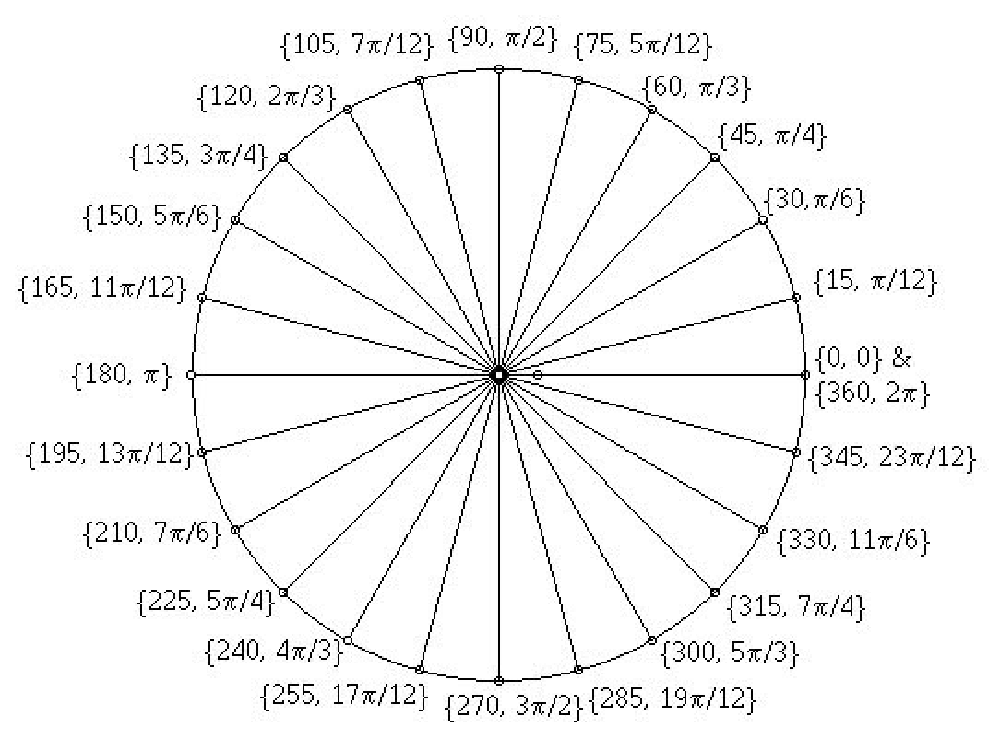
The user may calculate every π/4 interval from Cycle 1 through a selected maximum number of cycles, or restrict the calculation to even-numbered cycles only. This allows the researcher to separately study the complete π/4 sequence or concentrate on the even intervals associated with the cardinal-cross structure.
Once the pivots are calculated, the user can click any individual pivot in the left panel and immediately display only the future dates generated from that specific pivot. A separate Show All Projections function restores the complete projection table.
Key Functions
Analyzes SPX cash market daily data, e-mini continuous market daily data, and Bitcoin daily data
Accepts a user-defined start date and end date
Finds significant pivot highs and lows using a selectable bar-strength setting
Provides selectable price multipliers of 0.1, 0.01, 0.001 and .0001
Converts each market pivot into an adjusted price value for time-cycle analysis
Allows the user to select the total number of π/4 cycles to project forward
Calculates either all π/4 cycles from 1 through N or even-numbered cycles only
Provides separate Adjusted Price as Days and Adjusted Price as Hours projection modes
In Days mode, multiplies the adjusted pivot price by the selected π/4 interval to calculate projected calendar days
In Hours mode, multiplies the adjusted pivot price by the selected π/4 interval, treats the result as hours, and divides by 24 to calculate projected calendar days
Preserves fractional calendar days so projected dates can also include calculated times
Allows any individual pivot to be selected from the left panel so only its future projections are displayed
Includes a Show All Projections function to restore the complete projection table
Sorts results by original pivot dates or future projected dates
Exports the projection results to a CSV file for additional market-cycle research
Two Projection Methods
Adjusted Price as Days:
Adjusted Pivot Price × Cycle × π/4 = Projected Calendar Days
Adjusted Price as Hours:
Adjusted Pivot Price × Cycle × π/4 = Projected Hours
Projected Hours ÷ 24 = Projected Calendar Days
Output
The software produces a detailed projection table showing the original pivot date, whether the pivot was a high or low, the original pivot price, the adjusted price, the π/4 cycle number, the calculated number of days added, and the resulting future projected date and time.
By switching between the Days and Hours projection methods, changing the price multiplier, comparing all π/4 intervals with even-numbered intervals, and isolating individual market pivots, the researcher can examine multiple price-to-time relationships from a single significant market turning point.