


Vsk Revolution Fleet Performance (Average Speeds / Record Times)
Application Name: Vsk Revolution Fleet Performance (Average Speeds / Record Times)
Version: 1.0
Developed By: Hydrofoil Telemetry™
Date: July 2024
Table of Contents
- Introduction
- System Requirements
- Installation and Setup
- Feature Overview
- File Upload
- Race Course Info Display
- Results Table
- Data Visualization
- Clear All Data
- Troubleshooting
- FAQ
- Contact Information
1. Introduction
This application is designed to help you track and analyze Vsk yacht race performance by processing race results and visualizing them in both tabular and graphical formats. It supports multiple consecutive file uploads, providing detailed insights into race times, average speeds, and more.
2. System Requirements
- Operating System: Windows, macOS, or Linux with a modern web browser (e.g., Chrome, Firefox, Safari)
- Browser: Latest version of a modern web browser
- Internet Connection: Required for online features and updates
3. Installation and Setup
- Download the application files from the provided source.
- Extract the files to your preferred directory.
- Open the index.html file in your web browser to start using the application.
4. Feature Overview
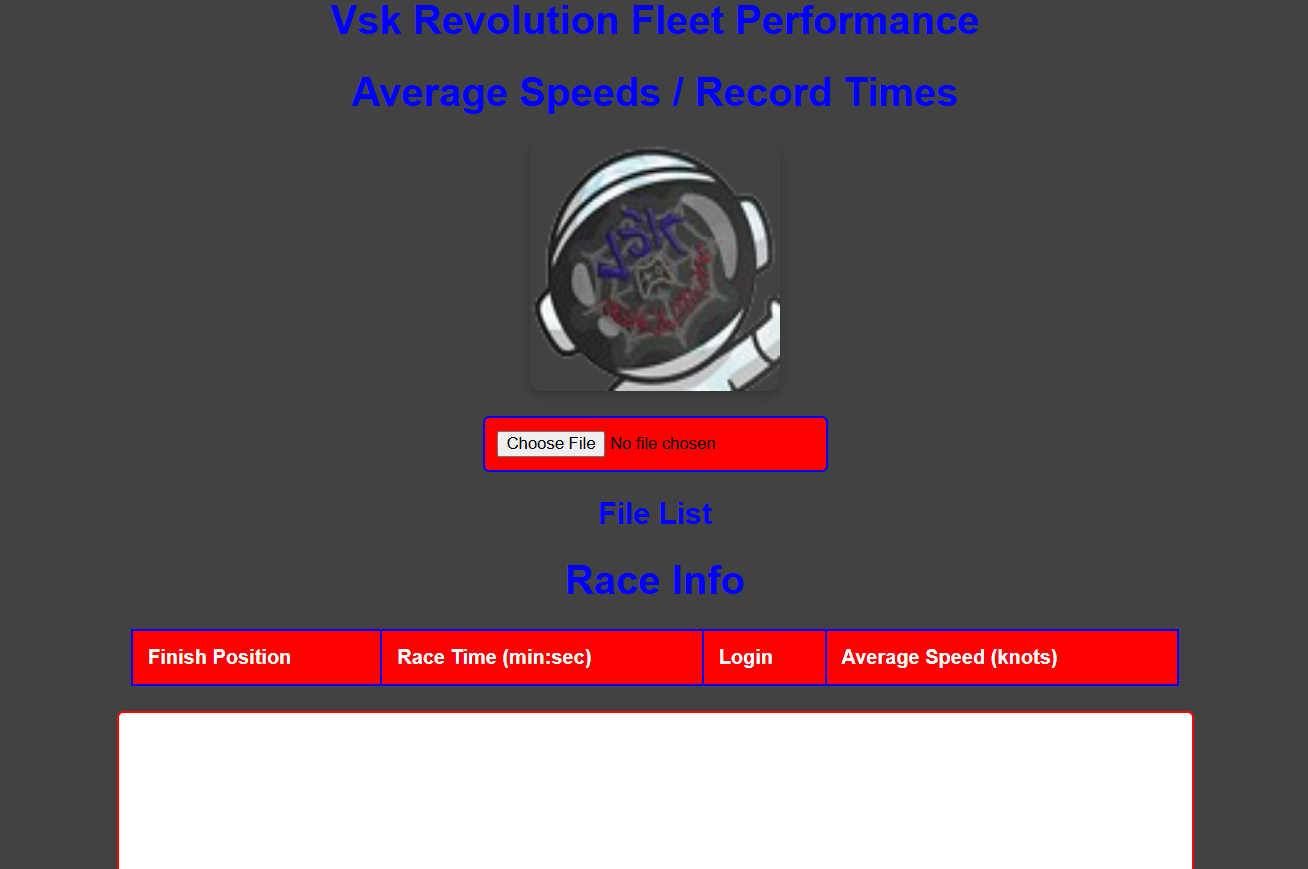
4.1 File Upload
Description: Allows users to upload CSV files containing race results. Multiple files can be uploaded consecutively.
Usage:
- Click on the "Choose File" or "Select Files" button.
- Select one or more CSV files from your local storage.
- The application will read and process the files, updating the results table and chart accordingly.
File Format Requirements:
- The first line of the CSV must contain the race course information:
- Name: Name of the race course.
- Wind Force: Wind force in knots.
- Distance: Race distance in nautical miles.
- Record Time: Record time in min:sec format.
- Class: Boat classification (e.g., AC50).
Example First Line:
Copy code
Tropical, 7, 4.2, 14:56, AC50
4.2 Race Course Info Display
Description: Displays detailed information about the current race course, including the name, wind force, distance, record time, and class.
Location: The information is shown in the "Race Course Info" section.
Features:
- Name: The name of the race course.
- Wind Force: The wind force in knots.
- Distance: The distance of the race in nautical miles.
- Record Time: The record time for the course.
- Class: The boat classification used for the race.
4.3 Results Table
Description: Displays a tabulated list of race results extracted from the uploaded CSV files.
Columns:
- Finish Position: The position of the racer.
- Race Time (min): The time taken by the racer in minutes and seconds.
- Login: The login or name of the racer.
- Average Speed (knots): The average speed of the racer in knots.
Features:
- New Record Highlight: Times that beat the existing record are highlighted with a "New Record" label.
- Fast Time Highlight: Times that are faster than previous records are highlighted with a flashing animation.
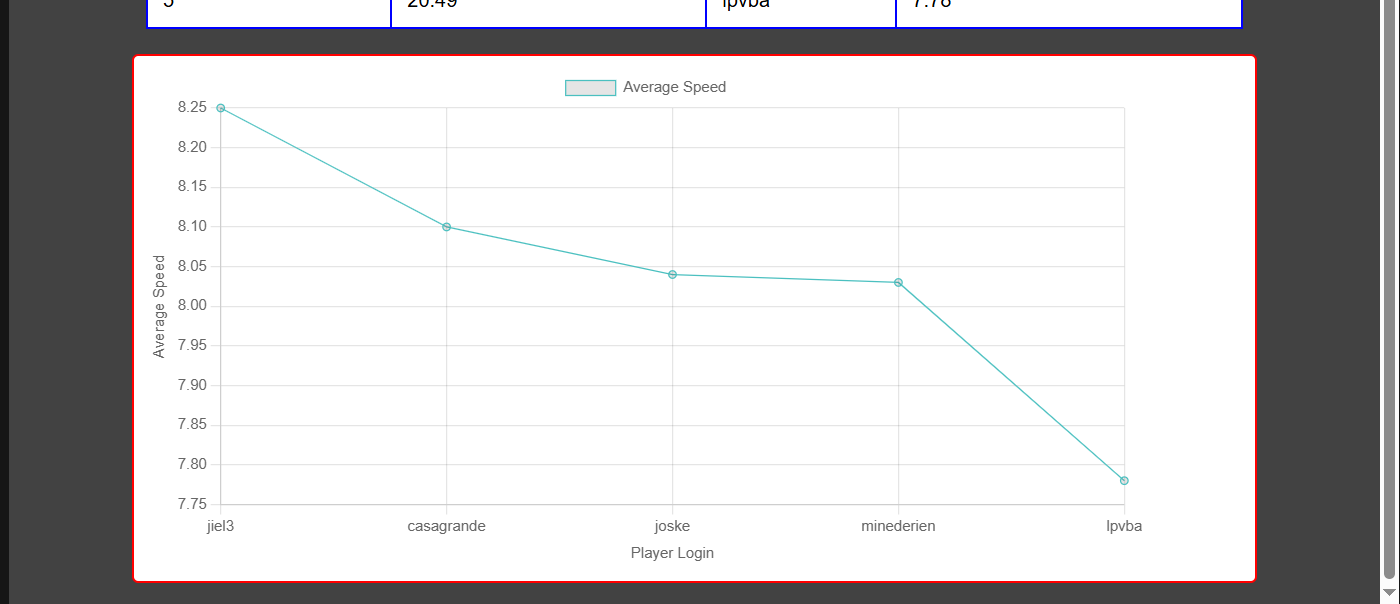
4.4 Data Visualization
Description: Provides a graphical representation of average speeds for each racer using a line chart.
Location: The chart is displayed in the "Chart Container" section.
Features:
- X-Axis: Displays player logins.
- Y-Axis: Displays average speed in knots.
- Line Chart: Plots average speeds against player logins for easy comparison.
Updating the Chart:
- The chart updates automatically when new data is uploaded.
- The previous chart is cleared before a new chart is drawn.
4.5 Clear All Data
Description: Resets the application state by clearing all displayed data and allowing the upload of new files.
Location: The "Clear All Data" button is prominently displayed below the file upload section.
Usage:
- Click the "Clear All Data" button.
- The application will:
- Clear the results table.
- Clear the race course info display.
- Reset the file input field.
- Clear all data variables and destroy the current chart instance.
Note: This action must be performed before uploading new files to ensure that previous data does not interfere with the new data.
5. Troubleshooting
Chart Not Displaying Properly:
- Ensure the chart instance is correctly destroyed before creating a new one.
- Check if the canvas element has the correct dimensions.
File Upload Issues:
- Verify the CSV file format matches the required structure.
- Ensure the file is not empty and contains valid race data.
Data Not Clearing:
- Ensure the "Clear All Data" button is functioning correctly and resetting all relevant variables.
6. FAQ
Q: What if the file format is incorrect?
A: The application will skip incorrect or invalid entries and display an error message if the file format is incorrect.
Q: Can I upload files in other formats?
A: Currently, only CSV files are supported. Ensure your files are correctly formatted as CSV.
Q: How often is the application updated?
A: Updates are made as needed. Check the official website for the latest version and update information.