

Year Trender C. Flow ® ℠🅪™ ©
On Sale
$139.00
$139.00
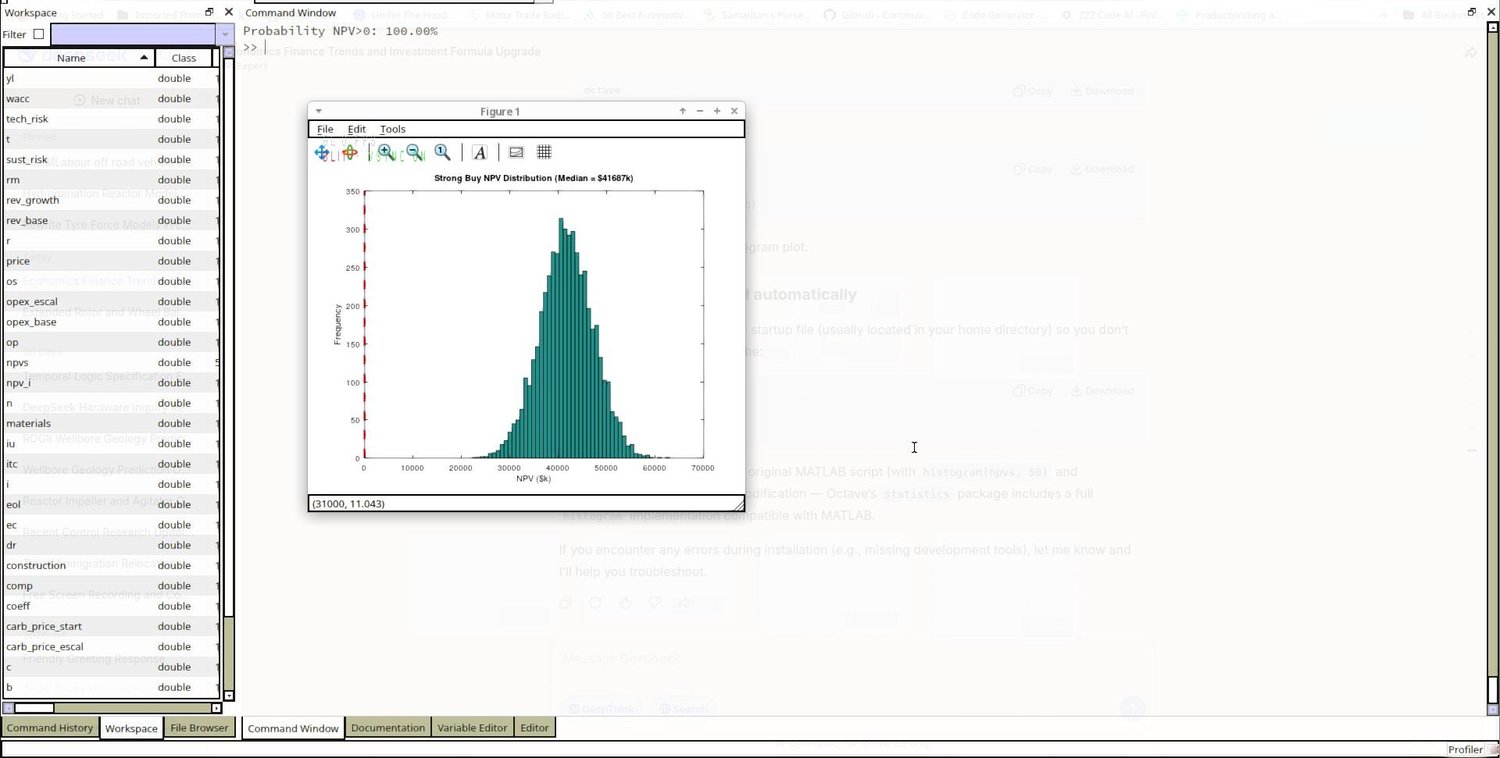
Viable Financial Model implemented and runs.
Benefit and cost subcomponents, directly supporting realistic buy/don’t‑buy decisions. These visuals make it crystal clear which value drivers are most critical and where costs concentrate.
Modular functional,
Contains in it utile argumented functions and usable functionalities for large cohort of Financial Analysts, Econmetrics applications.
Contains in it as well:
- Dashboard sheet – NPV, Benefit‑Cost Ratio, Payback, automatic STRONG BUY / BUY / NO GO flag based on realistic thresholds.
- Interactive Charts.
NPV_Investment_Model.xlsx autogeneration
Running program from organized structured code in T.C.E. Matlab Octave compatible.
One of my products Contain in it unique Perpetuity: Ct=Opext+EnergyCarbont+ITDatat+ComplianceESGt+EndOfLifeAllocationt
Extendable towards:
- “Decision Dashboard” after the plots: print a one‑page summary with NPV, benefit‑cost ratio, payback period, and a flag STRONG BUY if all criteria pass.
- Include scenario toggles: let the user choose “Pessimistic”, “Base”, “Optimistic” via input parameters, and regenerate all plots.
- Auto‑annotate risky components: if any single benefit subcomponent accounts for more than 40 % of total benefits, a warning appears.