



Agile Burndown Chart
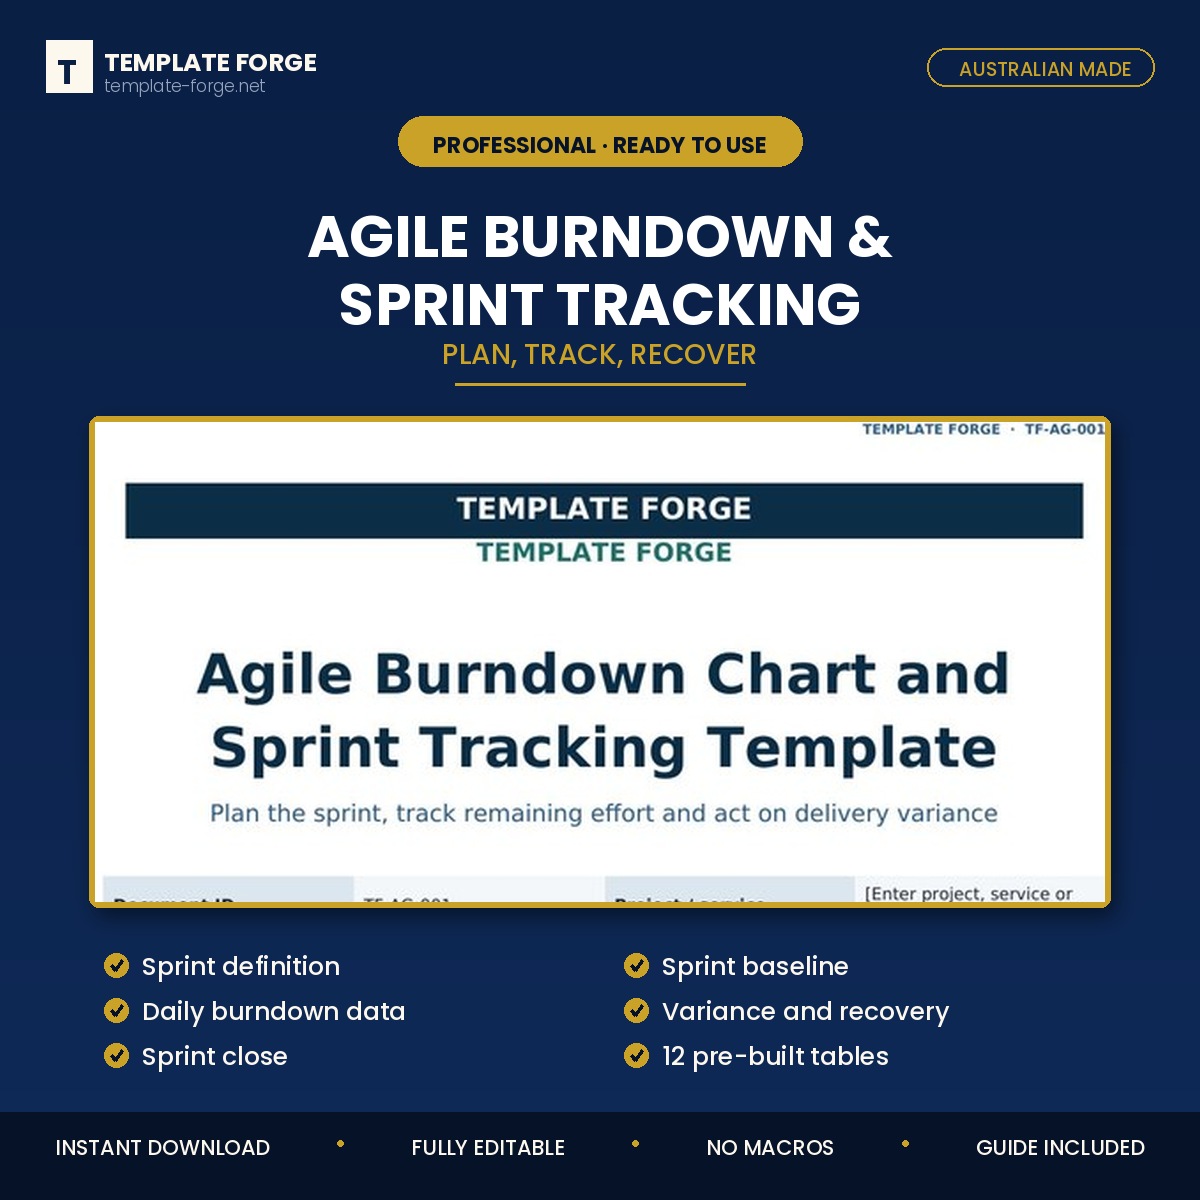
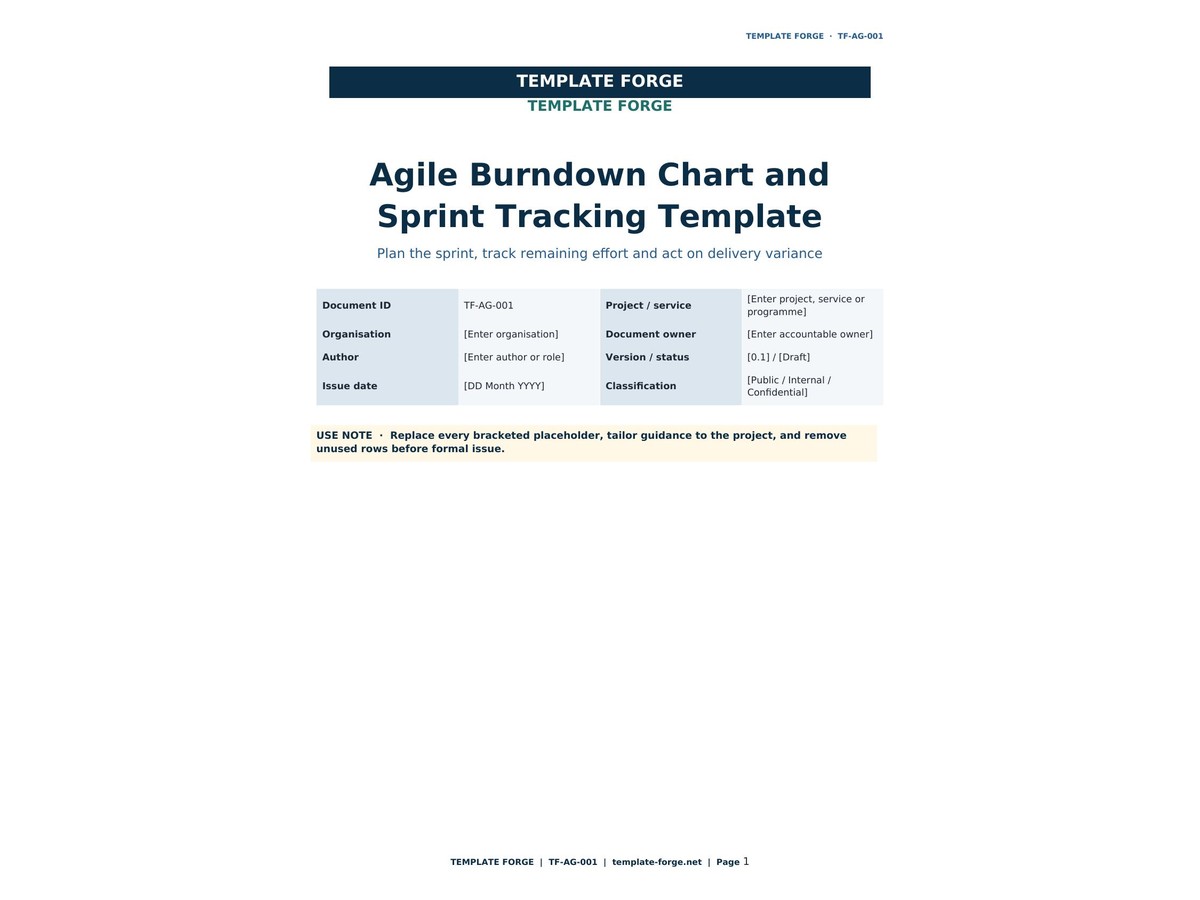
Plan the sprint, track the effort remaining, and act on the variance while there is still sprint left.
A burndown chart only helps if someone looks at it before the last day. This template records the daily position, calculates the variance against the ideal line, and asks the recovery question at the point it can still be answered.
What's inside
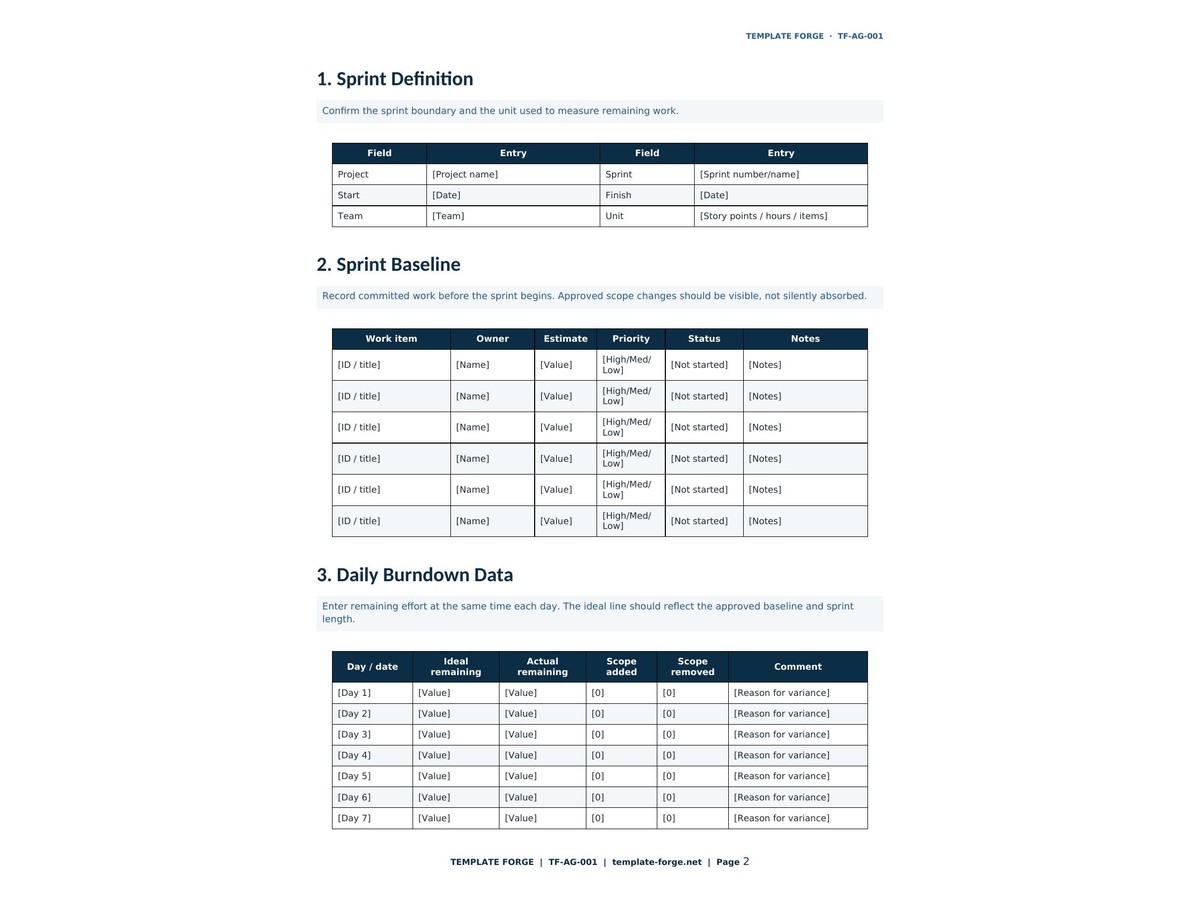
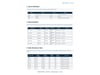
- Sprint definition — goal, dates, team, capacity
- Sprint baseline — committed points or hours, and the ideal burndown line
- Daily burndown data — remaining effort day by day
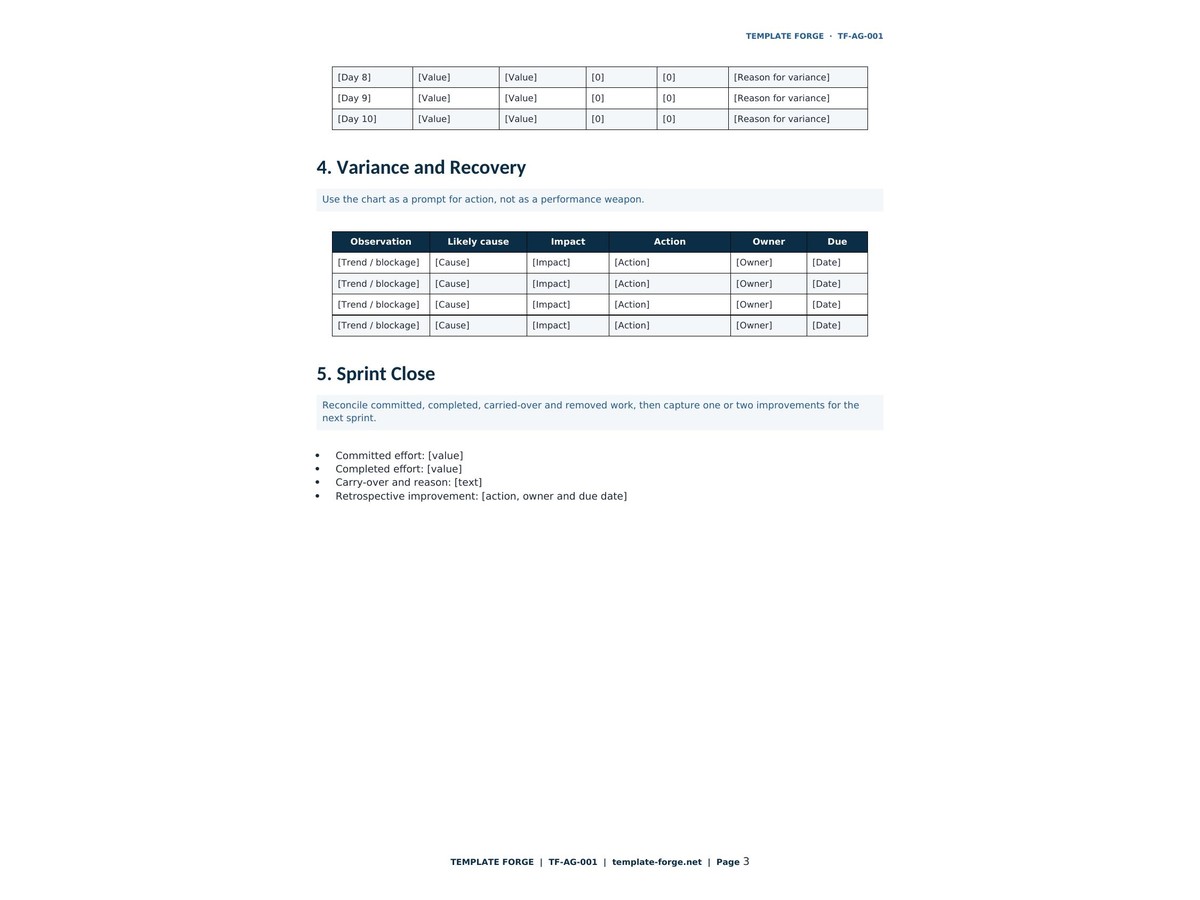
- Variance and recovery — where you are against ideal, and what the team will do about it
- Sprint close — what was completed, what carried over, and why
Twelve pre-built tables.
The number people misuse
Velocity. It is a planning tool for one team's own forecasting, not a performance score and never a comparison between teams. The moment points become a target, estimates inflate and the signal dies. This template treats velocity accordingly.
Who it's for
Scrum masters, delivery leads and teams who want the sprint tracked honestly — including teams who need a paper record because their organisation requires one.
Editable Word document. No macros, no subscription. Pairs with the Agile Delivery Dashboard (A$19) if you want the whole thing calculated in Excel across multiple sprints.
Built in Australia from more than twenty years of program delivery experience. Instant download, yours to keep, use it for as many sprints as you like.