
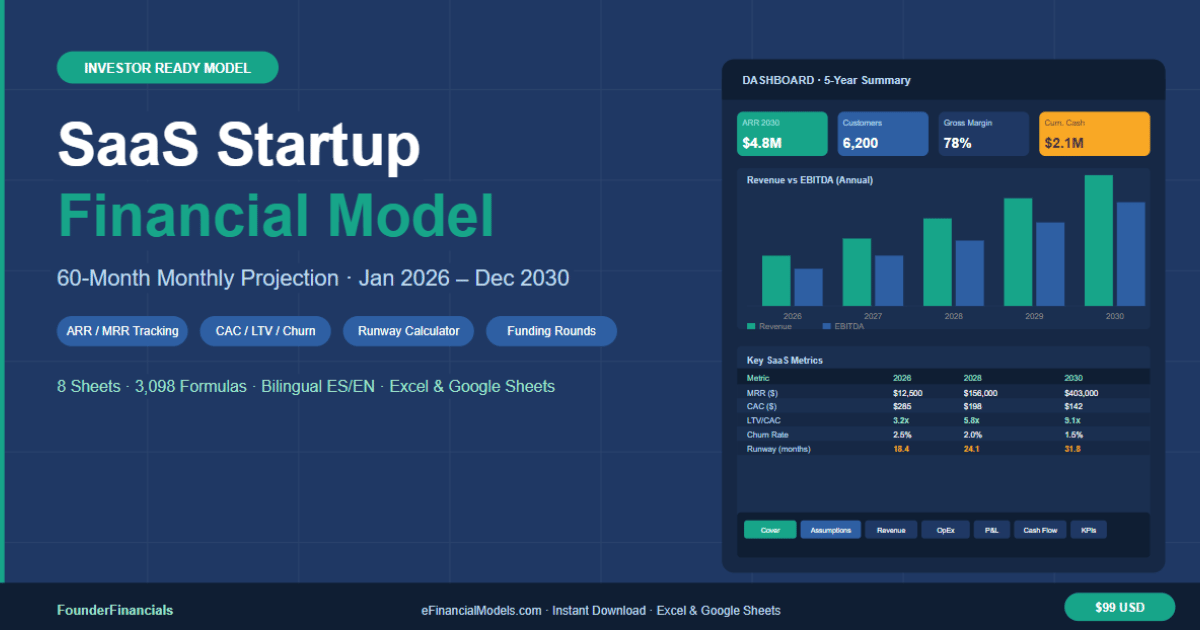


SaaS Startup Financial Model — 60-Month Monthly Projection 2026-2030 | Bilingual ES/EN
Financial model designer specialized in SaaS startups and early-stage companies. I build investor-ready Excel models with monthly projections, KPI dashboards, and automatic calculations — no finance degree needed to use them. Bilingual ES/EN
What is this financial model for?
This Excel-based financial model is designed specifically for SaaS startups and early-stage technology companies preparing for their first or second funding round. It provides a complete 60-month (5-year) monthly projection from January 2026 to December 2030, giving founders, CFOs, and investors a granular view of the business trajectory — month by month, not just year by year.
Whether you are building your pitch deck, stress-testing your unit economics, or planning your hiring roadmap, this model gives you the financial infrastructure to make confident decisions.
Key Features
The model contains 8 fully integrated worksheets with over 3,000 automatic formulas:
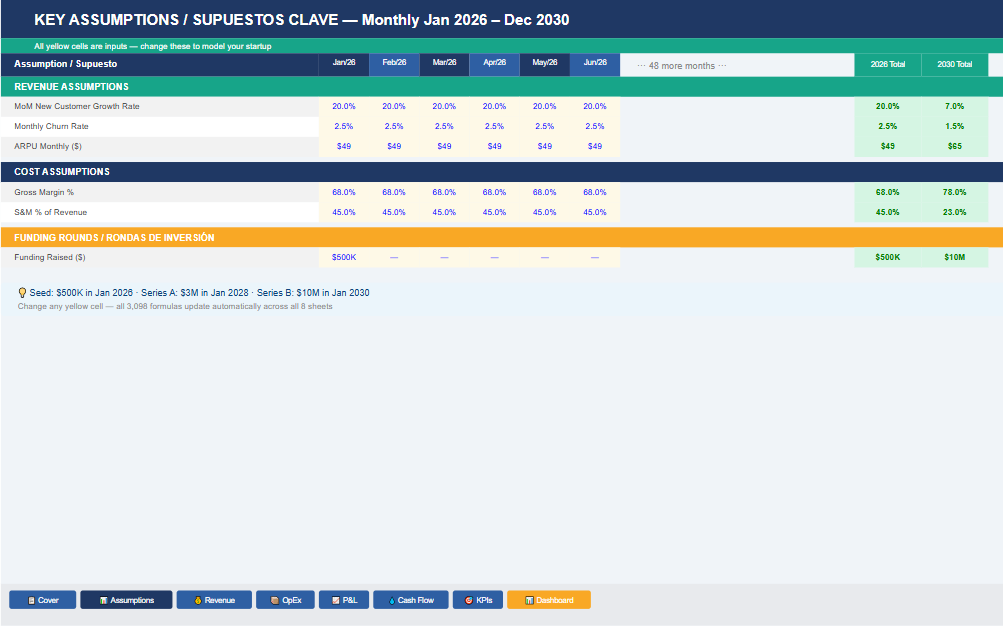
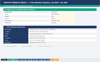
- Assumptions Sheet: Central control panel where you input monthly growth rates, churn, ARPU, gross margin targets, and funding round amounts. Change one assumption and the entire model updates instantly.
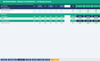
- Revenue Sheet: Projects MRR, ARR, new customers, churned customers, and expansion revenue month by month across 60 periods.
- OpEx Sheet: Calculates COGS, Sales & Marketing, R&D, and G&A as a percentage of revenue, plus fixed infrastructure costs.
- P&L Statement: Full monthly income statement including gross profit, EBITDA, depreciation, taxes, and net income — with annual summary columns.
- Cash Flow Sheet: Monthly operating, investing, and financing cash flows. Includes cumulative cash balance and automatic runway calculator in months.
- KPIs Sheet: Tracks the most critical SaaS metrics including ARR, MRR, CAC, LTV, LTV/CAC ratio, monthly churn rate, and runway.
- Dashboard: Executive summary with 4 KPI cards and 2 dynamic charts (Revenue vs EBITDA and Customer Growth) — ready to screenshot for investor presentations.
How to use this model
Open the Assumptions sheet first. All yellow cells are inputs — these are the only cells you need to edit. Enter your starting customer count, monthly growth rate, ARPU, churn rate, gross margin, and planned funding rounds. Every other sheet calculates automatically from these inputs. No formula editing required.
Why you need this model
Investors expect monthly projections, not annual summaries. This model speaks the language of venture capital — ARR, burn rate, runway, LTV/CAC — and presents it in a clean, professional format that builds credibility from the first meeting. It saves founders 20–40 hours of spreadsheet work and eliminates the risk of formula errors in front of investors.
Compatible with Microsoft Excel 2016+ and Google Sheets. Available in English and Spanish (bilingual).