


Amazon FBA Seller Profit and Inventory Tracker
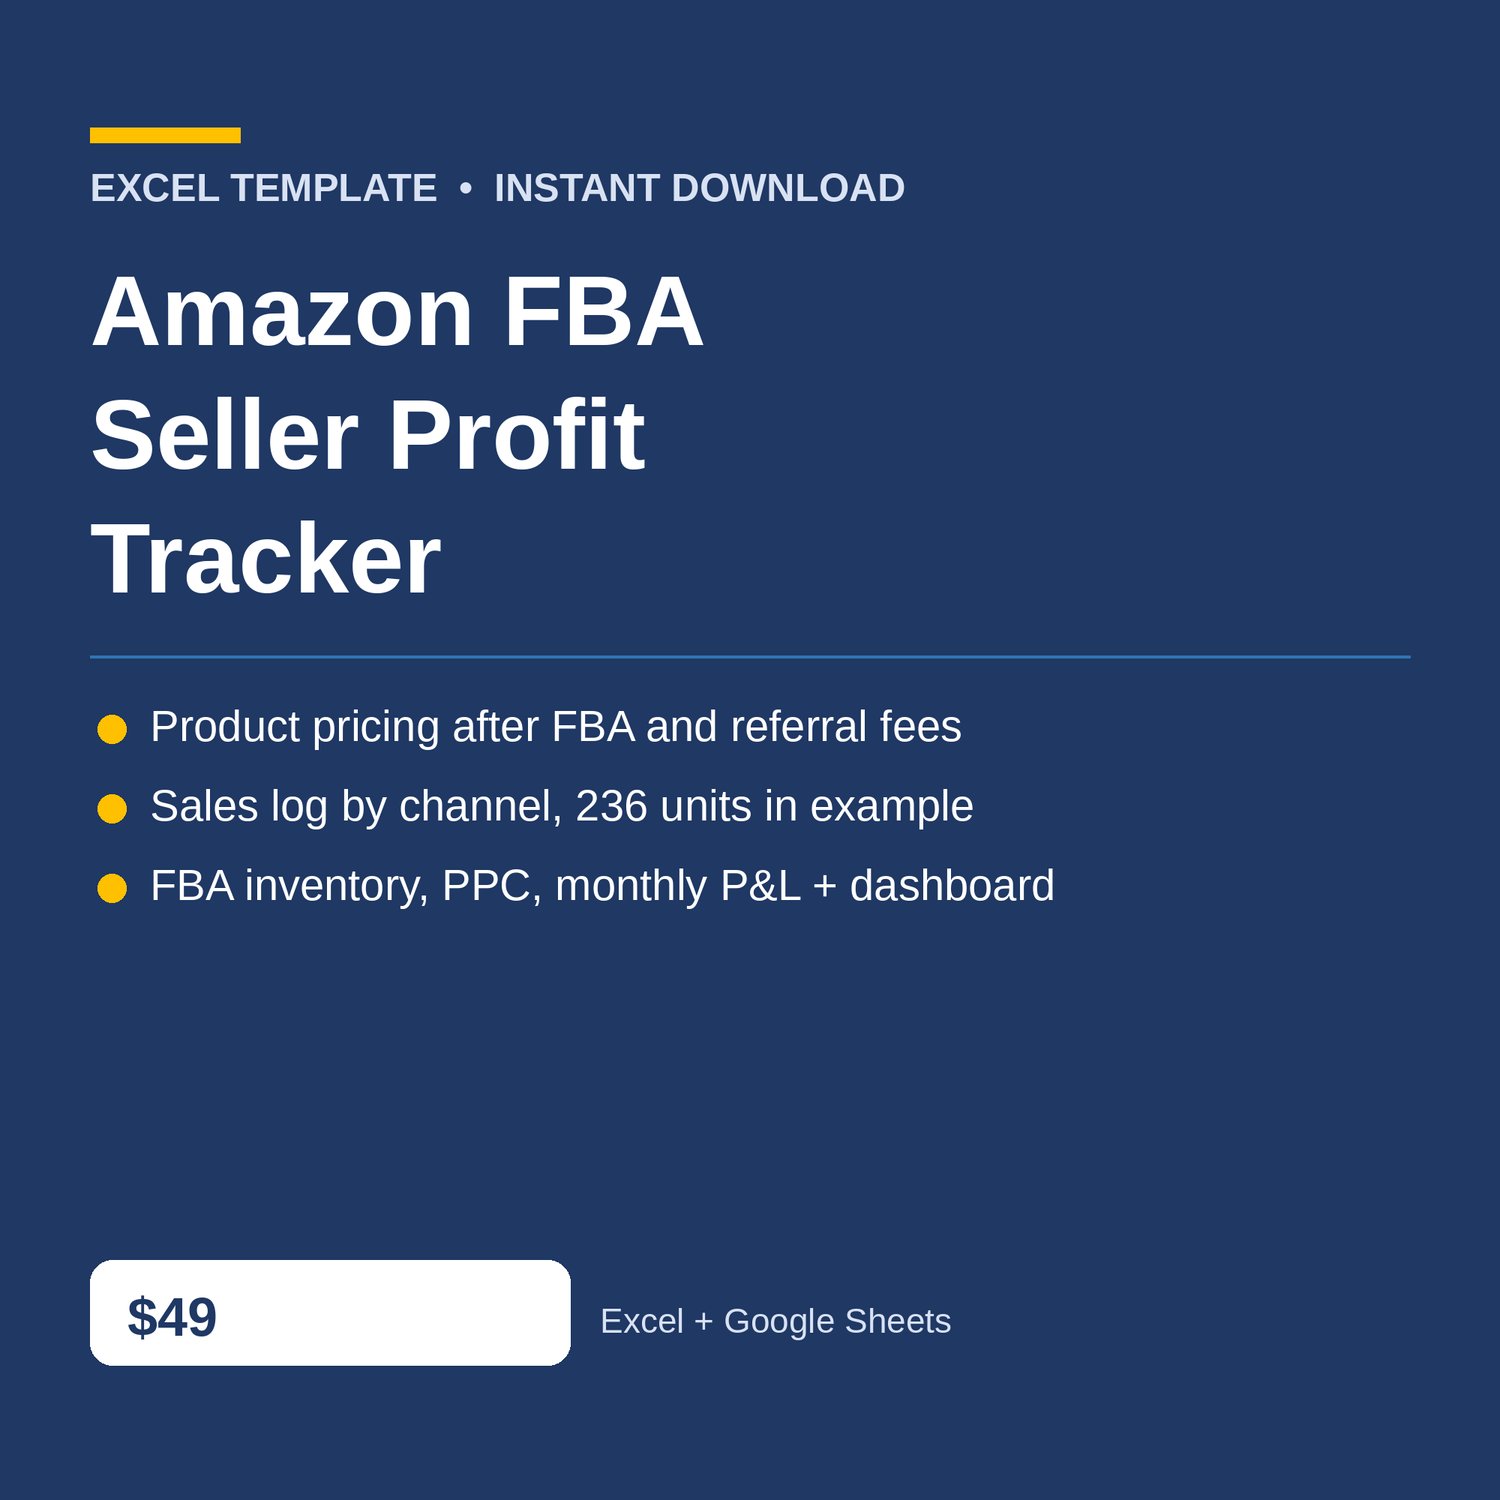
Amazon FBA Seller Profit Tracker Excel for Amazon sellers — product pricing after landed cost, FBA fulfillment, and referral fees, a sales log by channel, FBA inventory, and a monthly P and L dashboard with PPC. Know what every unit actually earns — and whether advertising left any profit.
Built for Amazon FBA and FBM sellers who need to know, product by product and order by order, whether the sale price covers the landed cost and the Amazon fees — without accounting software. If a product is losing money after fees, this workbook shows it before you ship more units to Amazon.
WHAT'S INCLUDED (6 sheets):
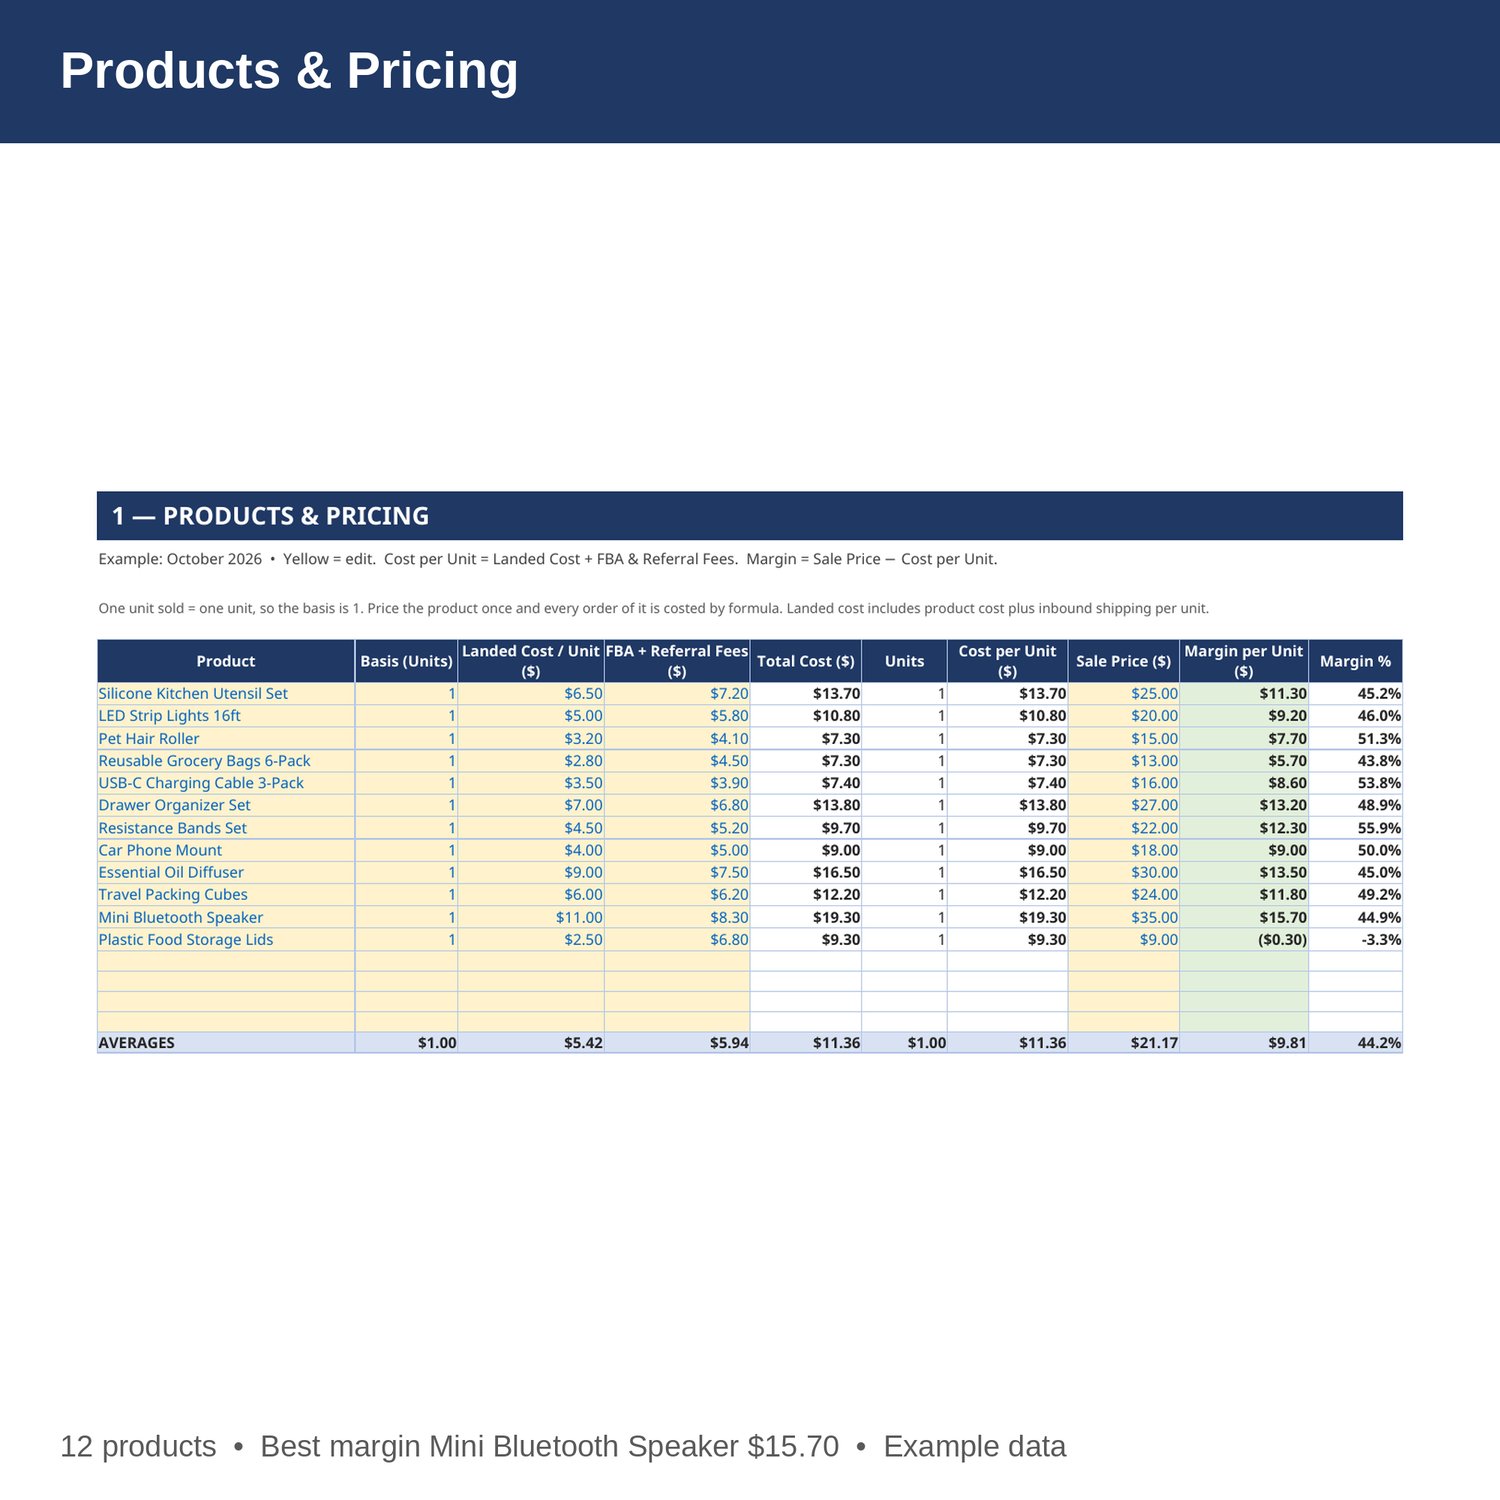
- Products and Pricing — unit landed cost, FBA fulfillment plus referral fees per unit, total cost per unit, sale price, and margin in dollars and percent for every product. Change a cost and every order profit updates by formula.
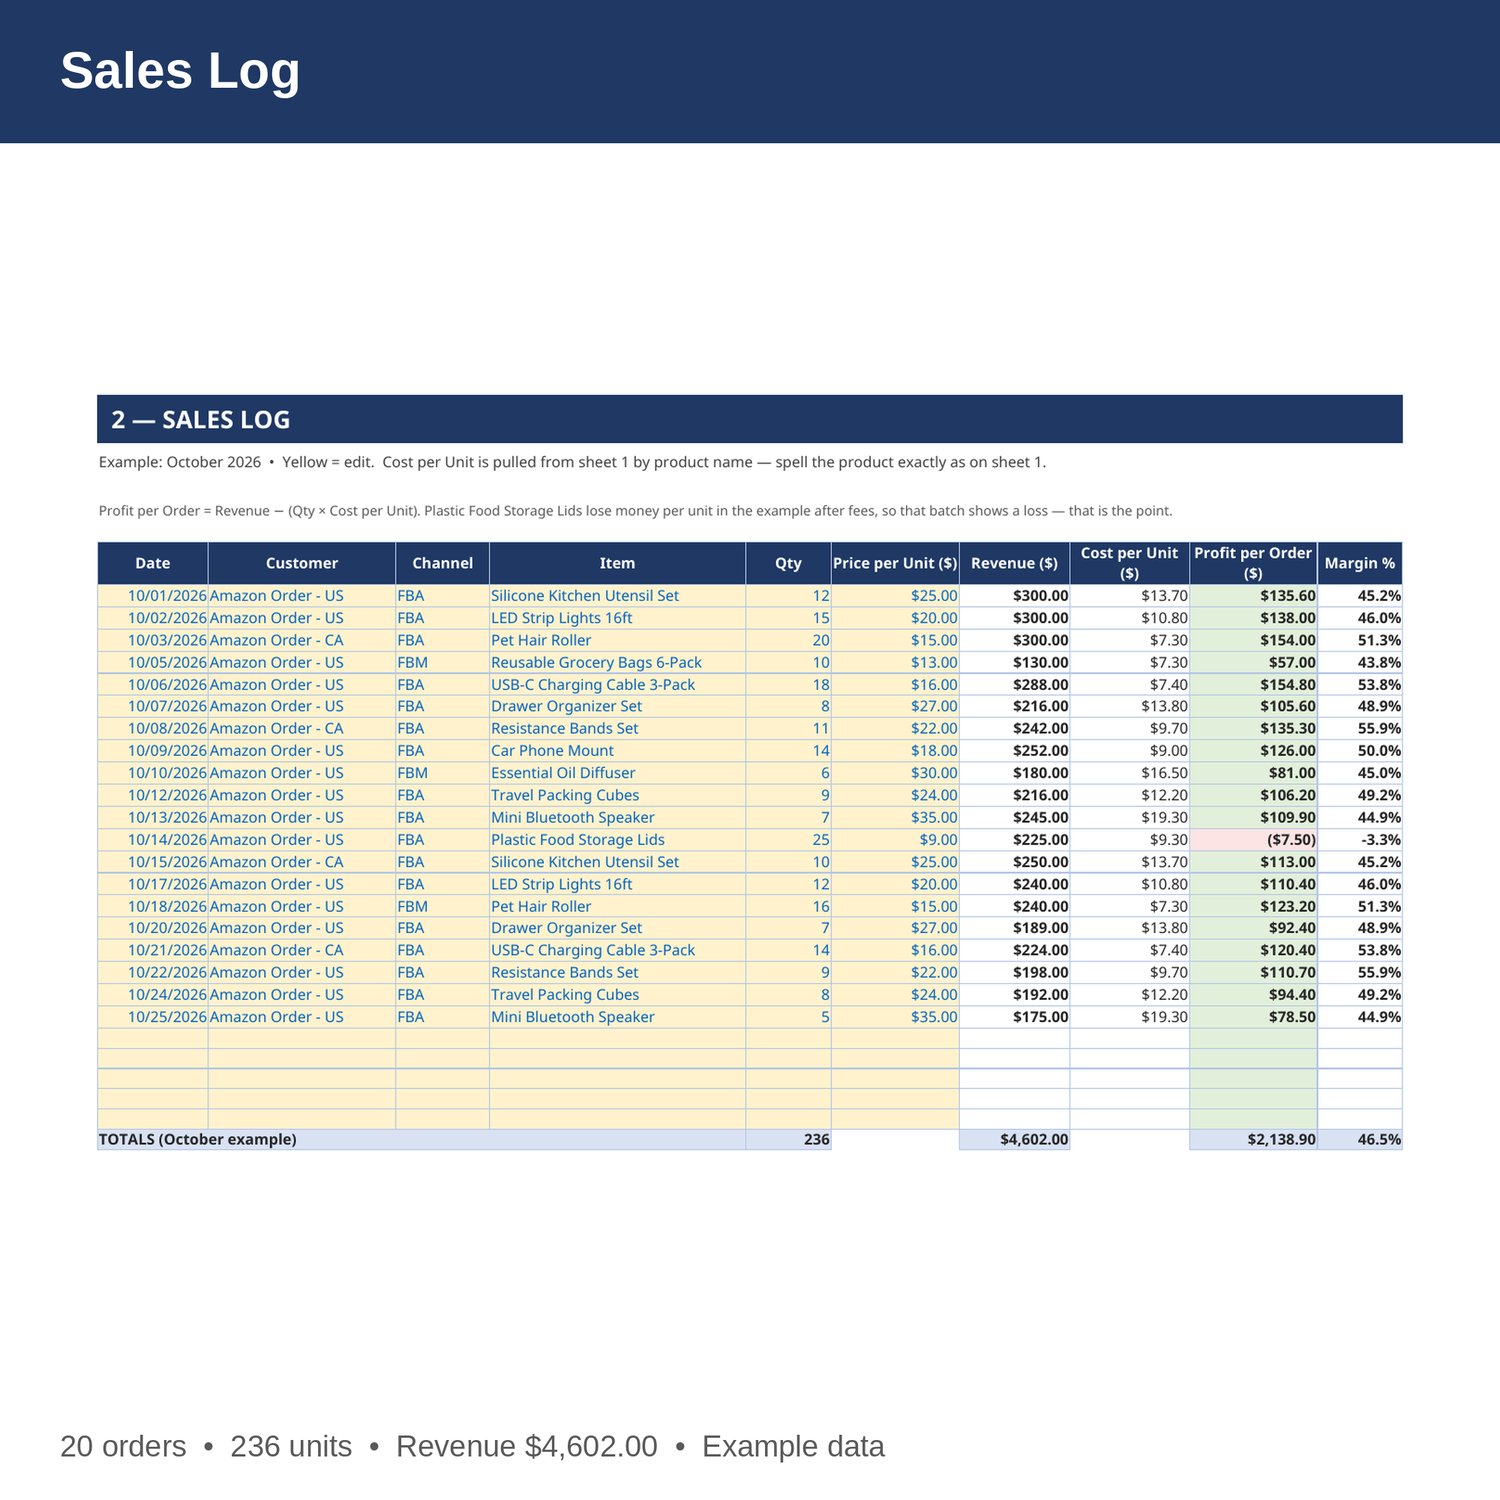
- Sales Log — date, customer placeholder, channel (FBA or FBM), product, quantity in units, price per unit, revenue, cost per unit pulled from the pricing sheet, profit per order, and margin. Log orders and batches in one place.
- FBA Inventory — product, unit, units on hand at Amazon, reorder point, unit landed cost, and stock value. Anything at or below its reorder point is flagged LOW STOCK so you ship more before it stocks out.
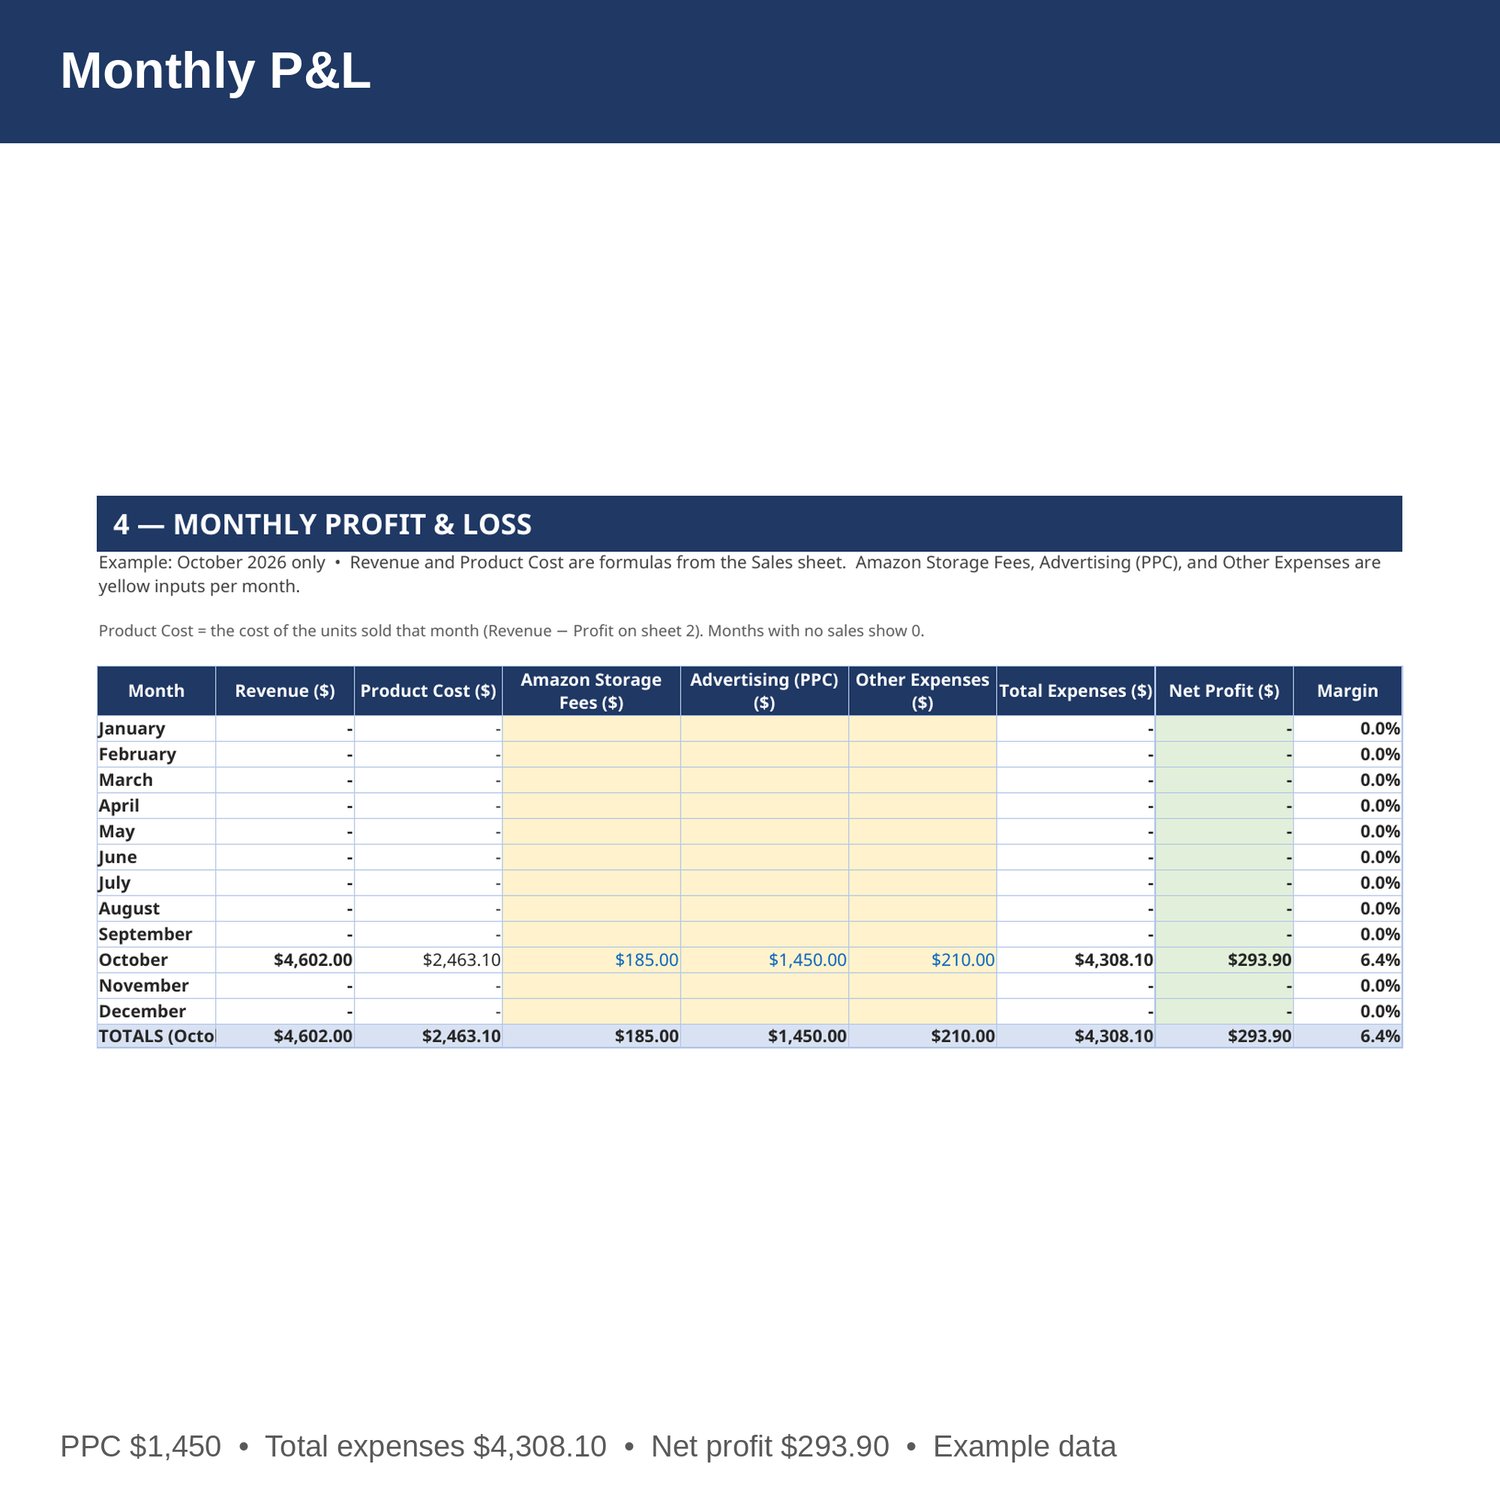
- Monthly P and L — revenue, product cost, Amazon storage fees, advertising (PPC), and other expenses by month, Jan-Dec, with net profit and margin. Revenue and product cost are formulas from the Sales sheet.
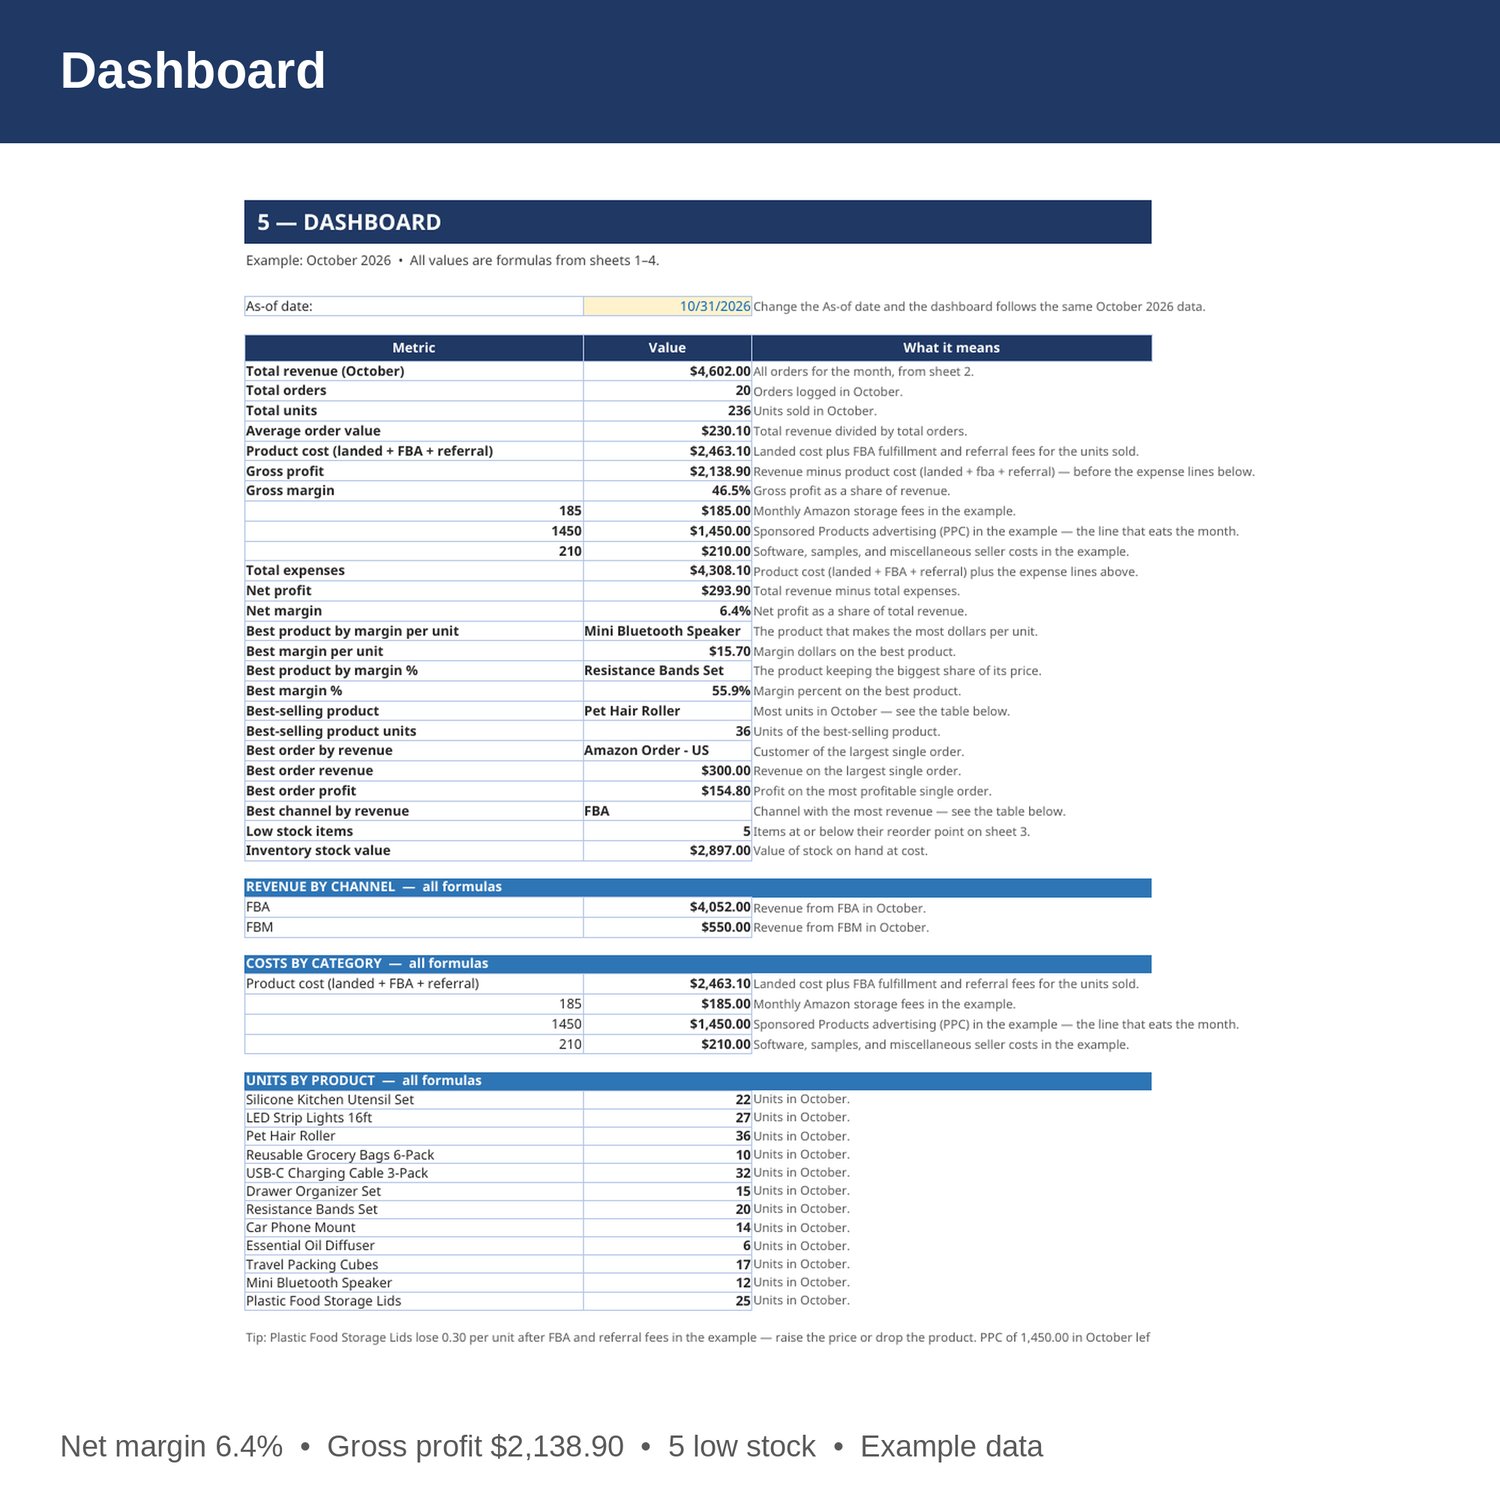
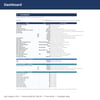
- Dashboard — total revenue, orders, units sold, average order value, gross and net profit and margin, best product by margin per unit and by margin percent, best-selling product, best order and best channel, costs by category, and low stock count.
- Cover and How to Use — start here. Yellow cells are the only ones you edit.
EXAMPLE DATA (October 2026 — replace with your own numbers):
- Total revenue 4,602.00 from 20 orders and 236 units sold; average order value 230.10.
- Product cost 2,463.10; gross profit 2,138.90; gross margin 46.5 percent.
- Amazon storage fees 185, advertising (PPC) 1,450, other expenses 210; total expenses 4,308.10; net profit 293.90; net margin 6.4 percent.
- Revenue by channel: FBA 4,052 (best), FBM 550.
- Best product by margin per unit: Mini Bluetooth Speaker, margin 15.70 per unit. Best product by margin percent: Resistance Bands Set, 55.9 percent (cost 9.70 per unit, price 22).
- Best-selling product: Pet Hair Roller, 36 units.
- Best order by revenue: Amazon Order - US, October 1, Silicone Kitchen Utensil Set x12 units — revenue 300.
- Inventory example: stock value 2,897, with 5 products at or below their reorder point — Silicone Kitchen Utensil Set, Reusable Grocery Bags 6-Pack, Drawer Organizer Set, Essential Oil Diffuser, and Mini Bluetooth Speaker.
HOW IT WORKS:
1. Download the Excel file instantly after purchase.
2. On sheet 1, enter each product's unit landed cost, FBA fulfillment plus referral fees per unit, and sale price. Cost per unit and margin fill in by formula.
3. On sheet 2, log every order or batch: date, customer placeholder, channel, product (spelled exactly as on sheet 1), quantity in units, and price per unit. Revenue, cost per unit, and profit fill in by formula.
4. On sheet 3, keep units at Amazon current and set a reorder point for each product. Ship more of anything flagged LOW STOCK before it stocks out.
5. On sheet 4, enter Amazon storage fees, advertising (PPC), and other expenses each month, then check gross and net profit on the Dashboard.
HOW THE NUMBERS WORK:
Cost per unit is unit landed cost plus FBA fulfillment and referral fees per unit. Margin per unit is sale price minus cost per unit. Margin percent is margin per unit divided by sale price. Gross profit is revenue minus product cost; net profit is revenue minus product cost, Amazon storage fees, advertising (PPC), and other expenses. One unit sold is one unit, so the basis on sheet 1 is 1.
WHO IT'S FOR:
Amazon FBA and FBM sellers who want product pricing, order profit, FBA inventory, PPC tracking, and a monthly P and L in one workbook — without accounting software.
PLEASE NOTE:
- This is a digital download. No physical item will be shipped.
- Works in Microsoft Excel and Google Sheets (upload to Google Drive to open in Sheets).
- Example data for October 2026 is included (12 products, 20 orders, 236 units sold, 12 FBA inventory lines). Replace it with your own numbers.
- The example is honest about the weak spots: Plastic Food Storage Lids lose 0.30 per unit after FBA and referral fees at a 9.00 price, and advertising (PPC) of 1,450.00 eats most of the gross profit, leaving October net margin at only 6.4 percent. FBA and referral fees are entered as one combined amount per unit on sheet 1 — split them out on your own copy if you track them separately. Customer names in the example are region placeholders, not real buyers.
- This is a bookkeeping and planning tool only, not tax, legal, or CPA advice.
- Due to the nature of digital downloads, refunds are not available. Message me before buying if you have a question.
Built by an accountant: B.S. Accountancy, ASU W. P. Carey, with revenue-reconciliation experience at Marriott and audit work at PwC.