
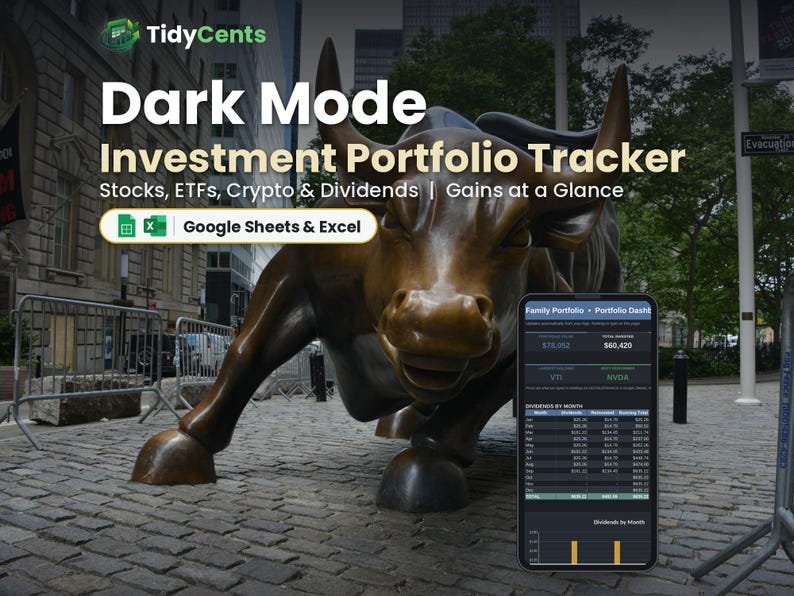
Dark Mode Investment Portfolio Tracker Spreadsheet | Stock ETF Crypto and Dividend Tracker | Google Sheets & Excel Template | Rebalancing
DARK MODE EDITION — the same template with an easy-on-the-eyes dark design, perfect for night owls and screens.
See all your stocks, ETFs and crypto in one place with this Investment Portfolio Tracker spreadsheet: gains, dividends and allocation at a glance.
WHAT'S INSIDE
- Start Here: type your details and settings once, with simple step-by-step instructions
- Dashboard: total value, gains, allocation by asset type and dividends by month
- Holdings: ticker, type, account, shares, average cost, current price and target %
- Dividends: log dividends and interest as you receive them
- Help & FAQ: answers to the most common questions
FEATURES
✔ Gain/loss in $ and % for every holding
✔ Allocation by asset type
✔ Rebalancing helper: how much to buy or sell to reach your target %
✔ Dividends and interest by month
✔ Multiple accounts (brokerage, Roth IRA, 401(k), crypto wallet, HSA)
✔ Optional live prices in Google Sheets with GOOGLEFINANCE
✔ Room for up to 100 holdings
HOW IT WORKS
1. List your holdings with shares and average cost.
2. Update current prices (or use GOOGLEFINANCE in Google Sheets).
3. Check allocation, gains and dividends on the Dashboard.
YOU WILL RECEIVE
✔ 1 spreadsheet template (.xlsx)
✔ 1 DEMO file with sample data, so you can see how it works
✔ 1 PDF guide: how to open it in Google Sheets (free) or Excel
PLEASE NOTE
- This is a digital product. Nothing physical will be shipped.
- Works in Google Sheets (free Google account) and Microsoft Excel 2016 or newer / Microsoft 365.
- Not compatible with Apple Numbers.
- For tracking only, not financial advice. In Excel, prices are typed in by you.
- Due to the digital nature of this item, no returns, but please message us for any help.
- For personal or own-business use only (no resale or sharing of the file).
Light version also available in our shop.