Types of Graphs Posters and Folder Inserts
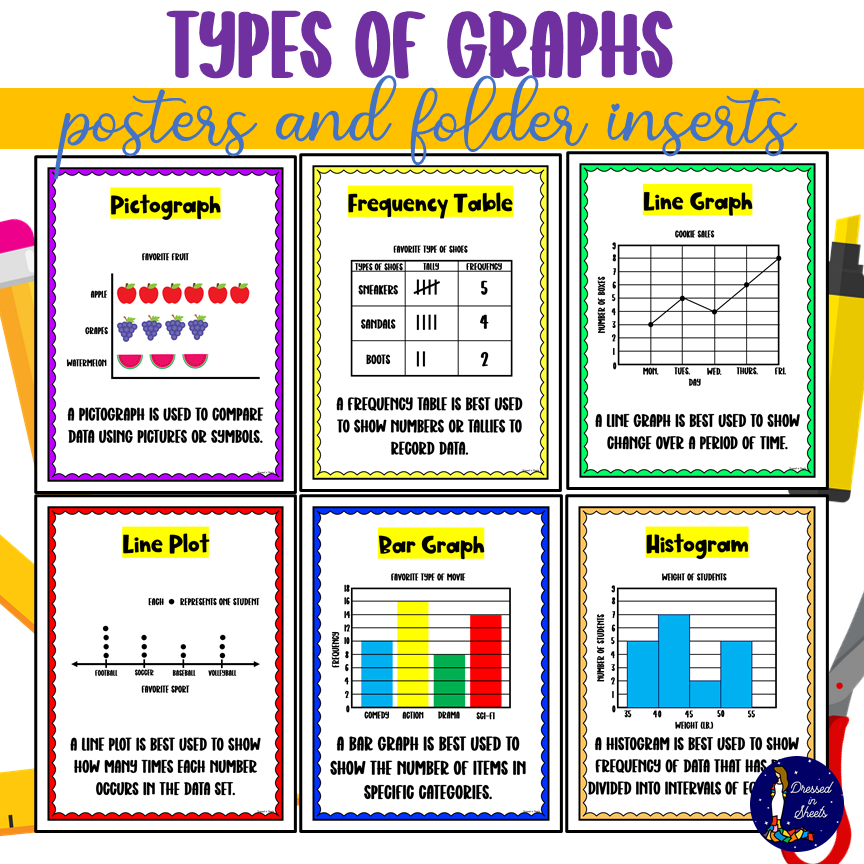
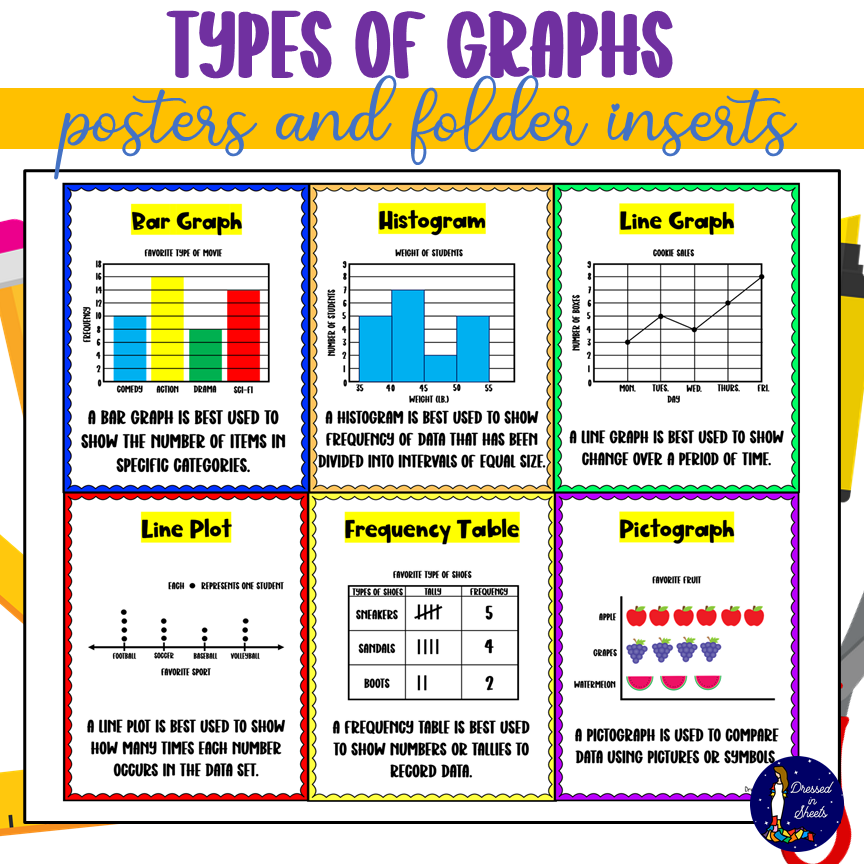
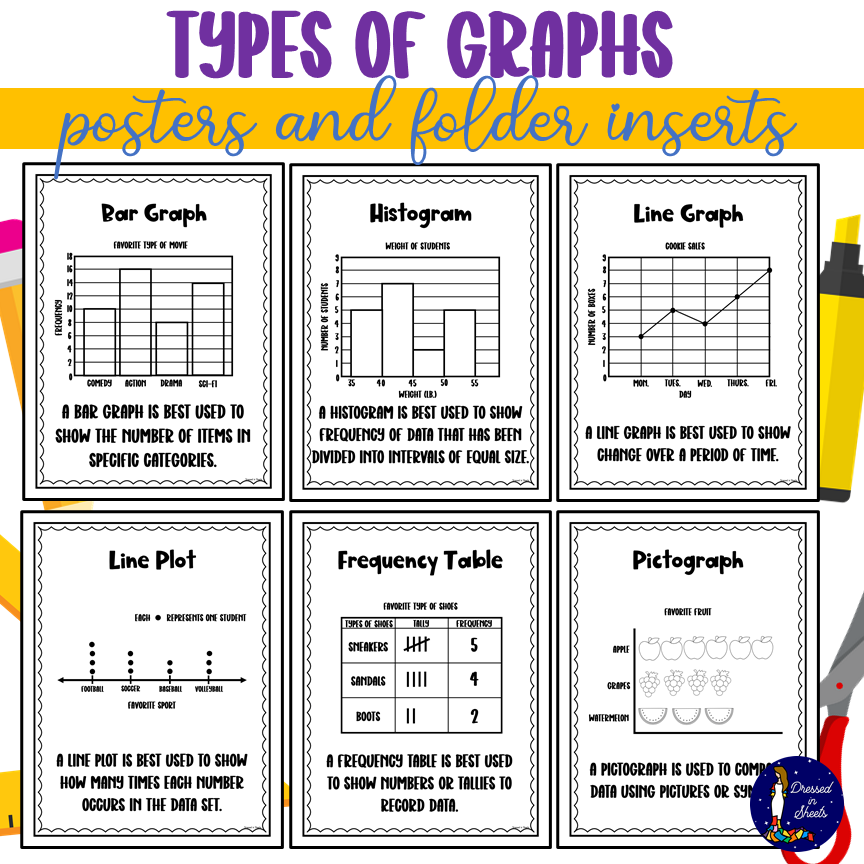
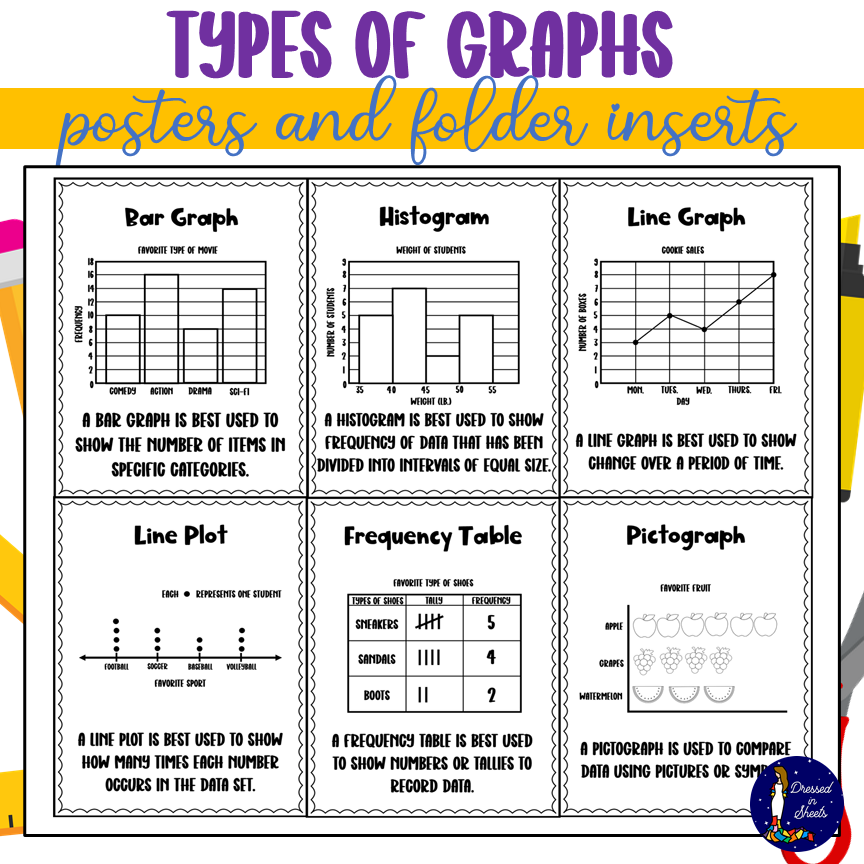
These set of posters in BOTH color and black and white will help your students identify different types of graphs. By identifying different types of graphs they will be better able to make graphs depending on the data they are given. For example, if you were to ask a student what kind of graph would better display the data of shoe sales in a period of 12 months, they would look at the posters and be able to deduce that they line graph would be the best choice. By recognizing different types of graphs they will be able to tell much more about the data included.
Includes posters for:
- bar graph
- histogram
- line graph
- line plot
- frequency table
- pictograph
This not only includes all posters but also includes folder inserts in BOTH color and in black and white which has all six posters in one page for students to easily refer to.
Thanks!


