
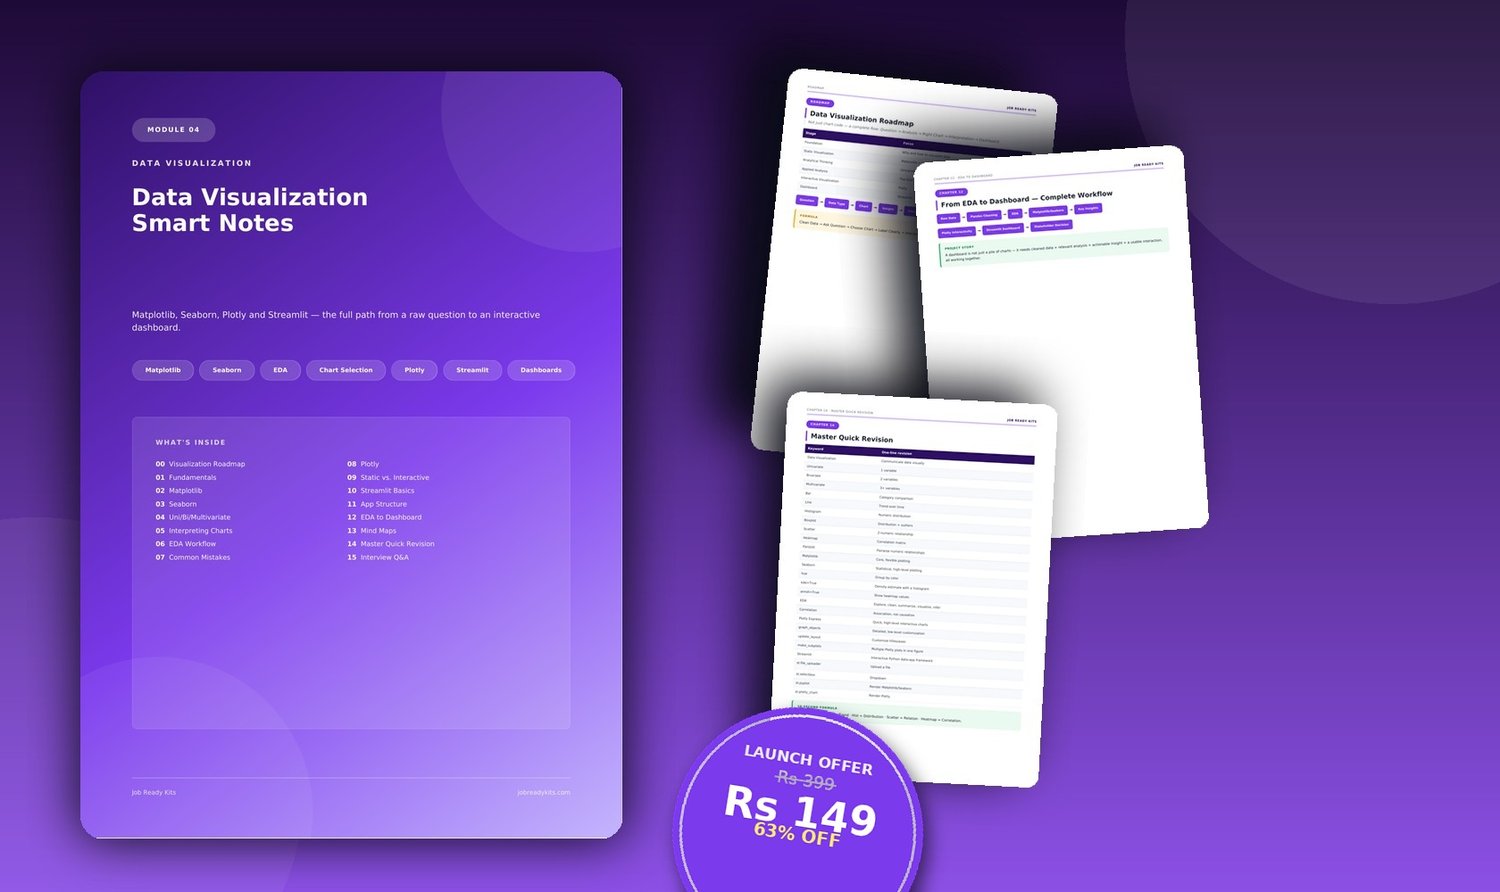
Data_Visualization_Smart_Notes
On Sale
₹149.00
₹149.00
Data Visualization Smart Notes
Tagline: Stop picking charts randomly. Learn to ask the right question first.
Most people learn chart syntax without ever learning chart selection — which is exactly what separates a junior analyst from a senior one. This notebook is built around one master framework: Question → Data Type → Chart → Insight → Story → Interaction — so you always know why you're building a scatter plot instead of a bar chart, before you ever touch the code.
What's inside (20 pages):
- The visualization roadmap & a full chart-selection cheat sheet
- Matplotlib fundamentals (the control layer)
- Seaborn for fast, statistical, DataFrame-friendly plots
- Univariate, bivariate & multivariate analysis — matched to the right chart every time
- How to actually interpret a histogram, boxplot, scatter plot & heatmap
- Common visualization mistakes that make charts misleading
- Plotly for interactive, web-ready, hover/zoom visuals
- Streamlit — building a full multi-page analysis dashboard
- The complete EDA → Dashboard workflow
- Interview Q&A + a 30-item hands-on practice checklist
Best for: Analysts who know how to plot but want to visibly level up their chart-selection judgment and dashboard skills.