

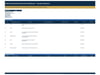
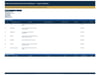
Critical Path Method Project Plan Dashboard
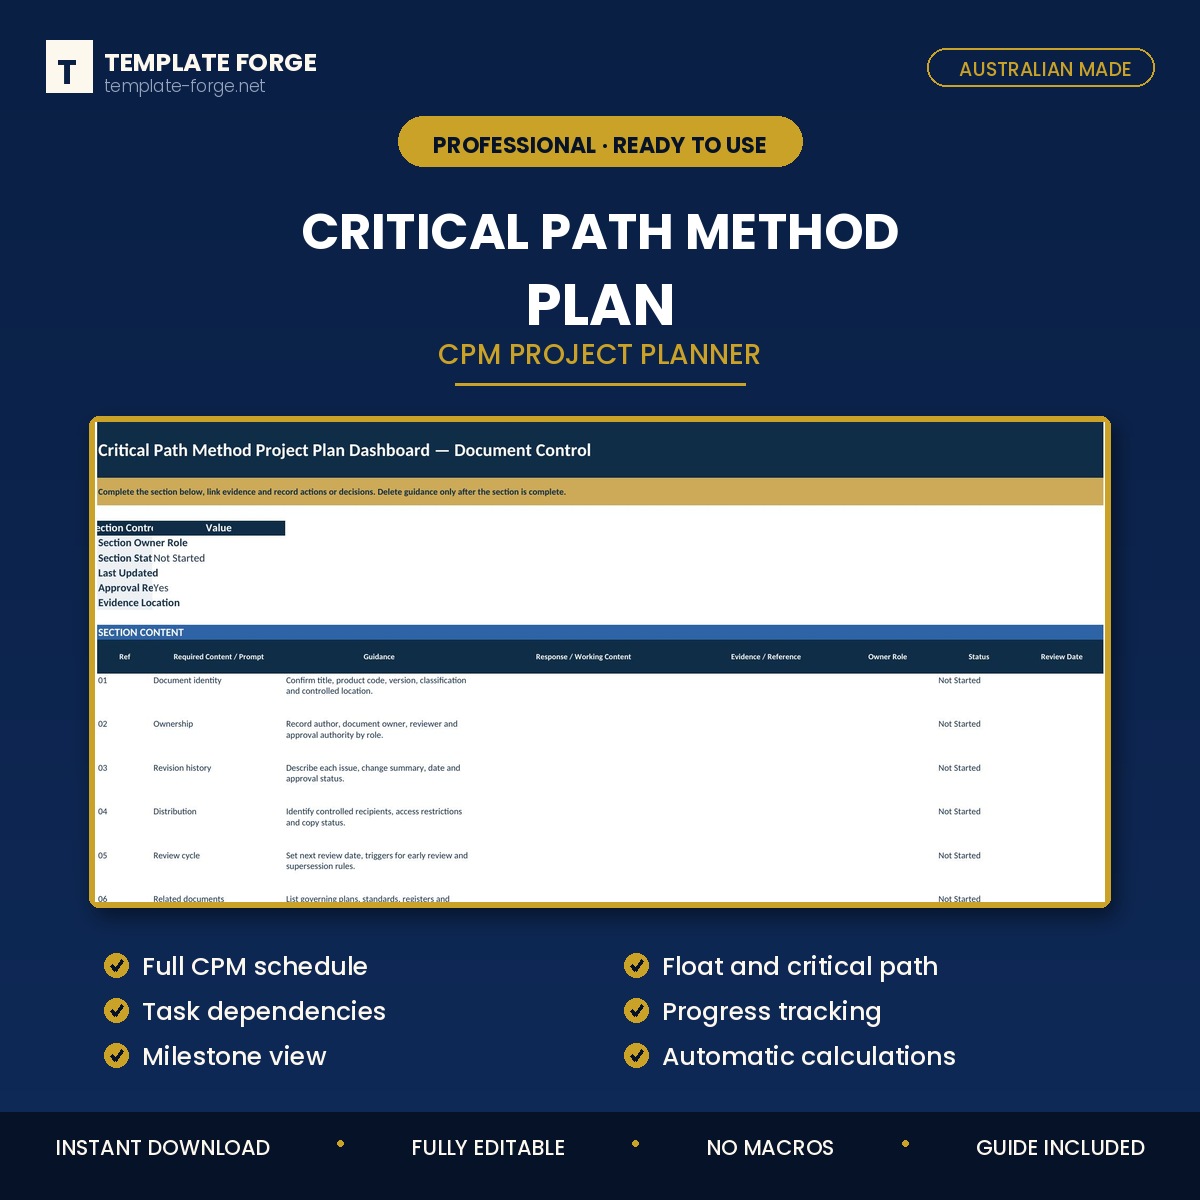
Critical Path Method Project Plan
The critical path calculated, not guessed — with float, dependencies and progress on one dashboard.
Most project spreadsheets have a task list and a bar chart, and no idea which tasks actually control the finish date. This one does the forward and backward pass properly: earliest and latest dates, total float, and the path where float runs out.
What's inside
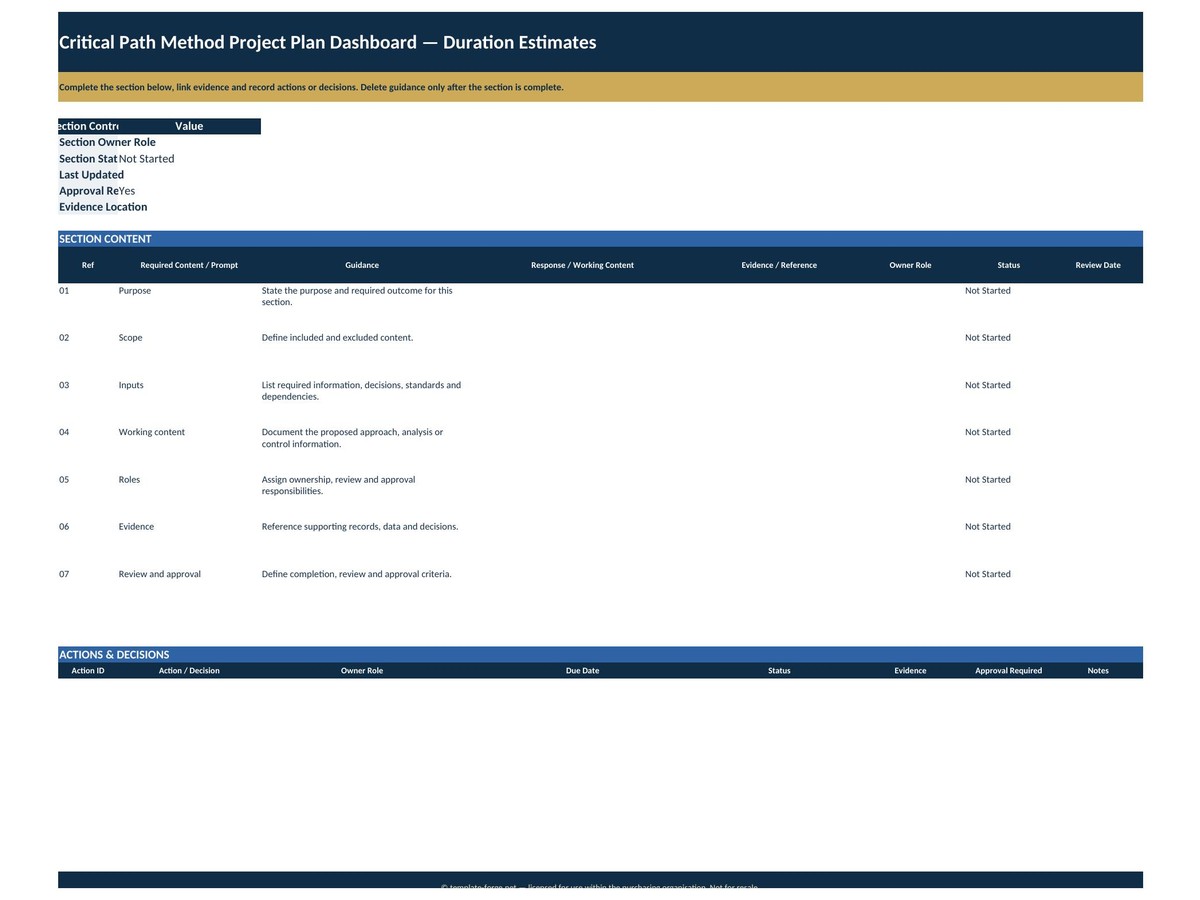
- Task schedule — durations, predecessors and successors
- Critical path — calculated from the dependency network, not marked by hand
- Float — total float per task, so you know what can slip and what cannot
- Dependencies — finish-to-start and the rest, handled properly
- Progress tracking — percentage complete against plan, with slip
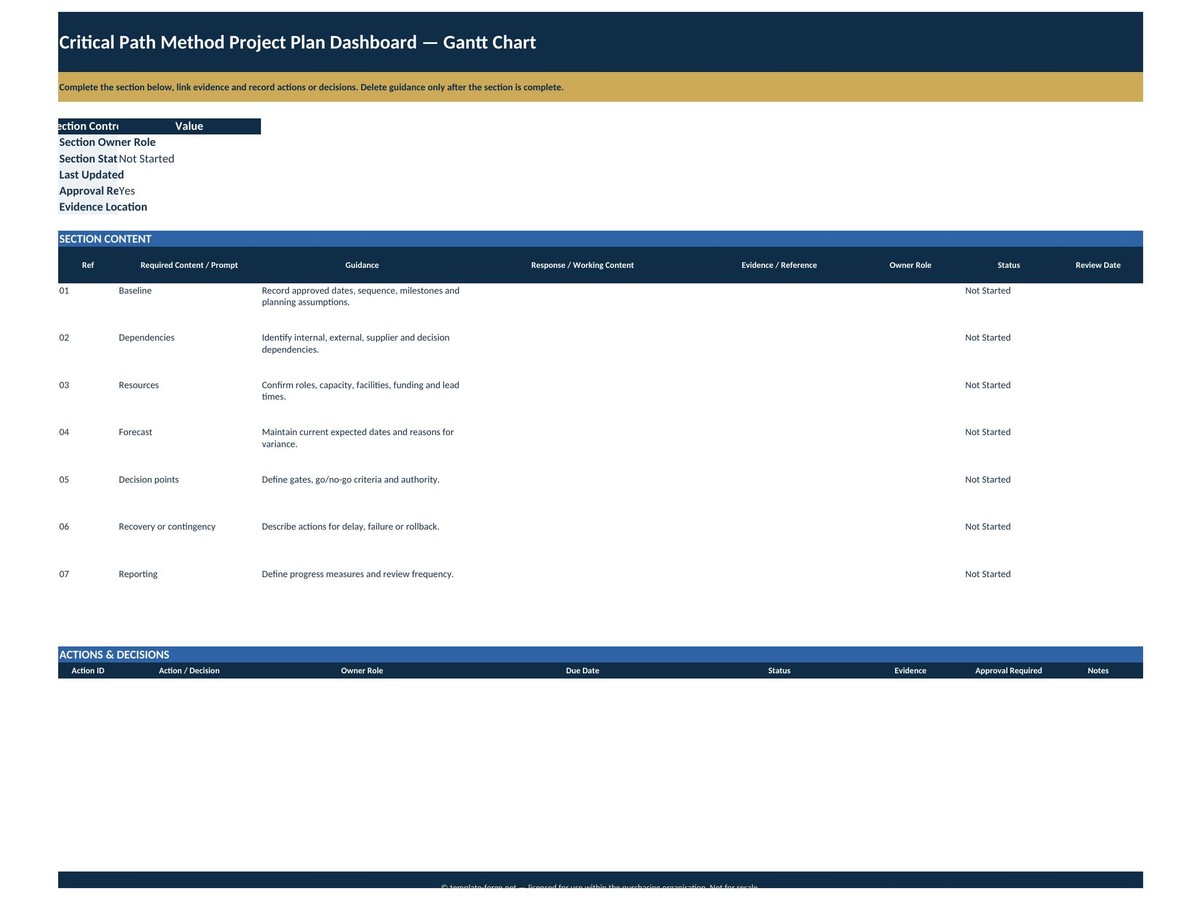
- Milestones — baseline against forecast
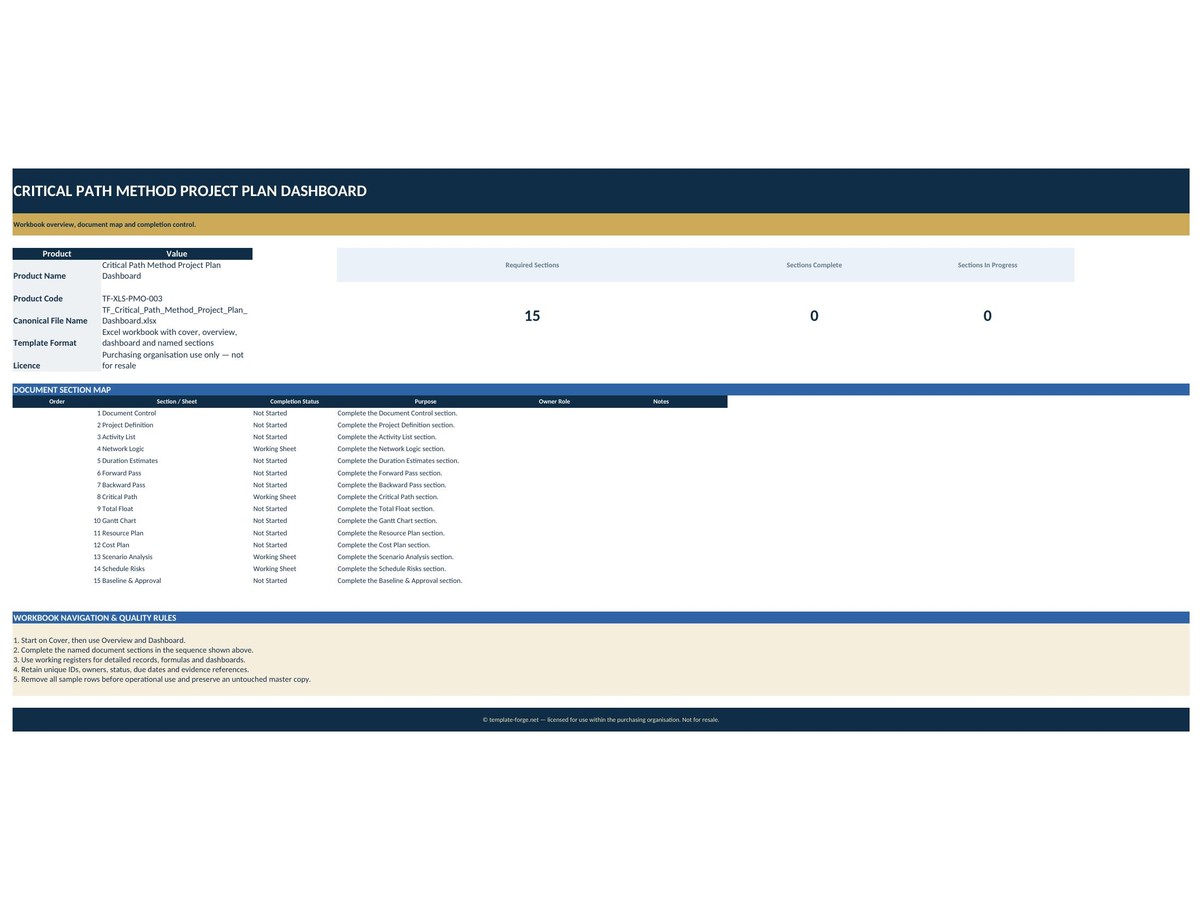
- Dashboard — schedule health, critical tasks and what is coming next
Why it matters
Because the question "can this slip?" has a numerical answer, and most teams guess it. A task with fifteen days of float can slip a fortnight without harming anything. A task with zero float slips the whole project by exactly as long as it slips. Knowing which is which is the difference between a schedule and a wish list.
Who it's for
Project managers, planners and site supervisors who need a defensible schedule without buying scheduling software or learning it.
How it works
Enter tasks, durations and what depends on what. The dates, float and critical path calculate themselves. No macros, no add-ins, no subscription — a normal Excel file that opens in any version of Excel and keeps working forever.
Pairs with the Waterfall Project Plan & Gantt if you want the visual timeline, and the Milestone Project Plan for reporting upward.
Built in Australia from more than twenty years of program delivery experience. Instant download, yours to keep, use it on as many projects as you like.