
Free YouTube Analytics Explained Simply — What Your Video Scores Actually Mean
Where this fits:
This product is part of the Behind The Upload Small Creator Learning Path.
Use this when you want to improve:
[thumbnail clarity / first 30 seconds / comments / viewer journey / analytics etc.]
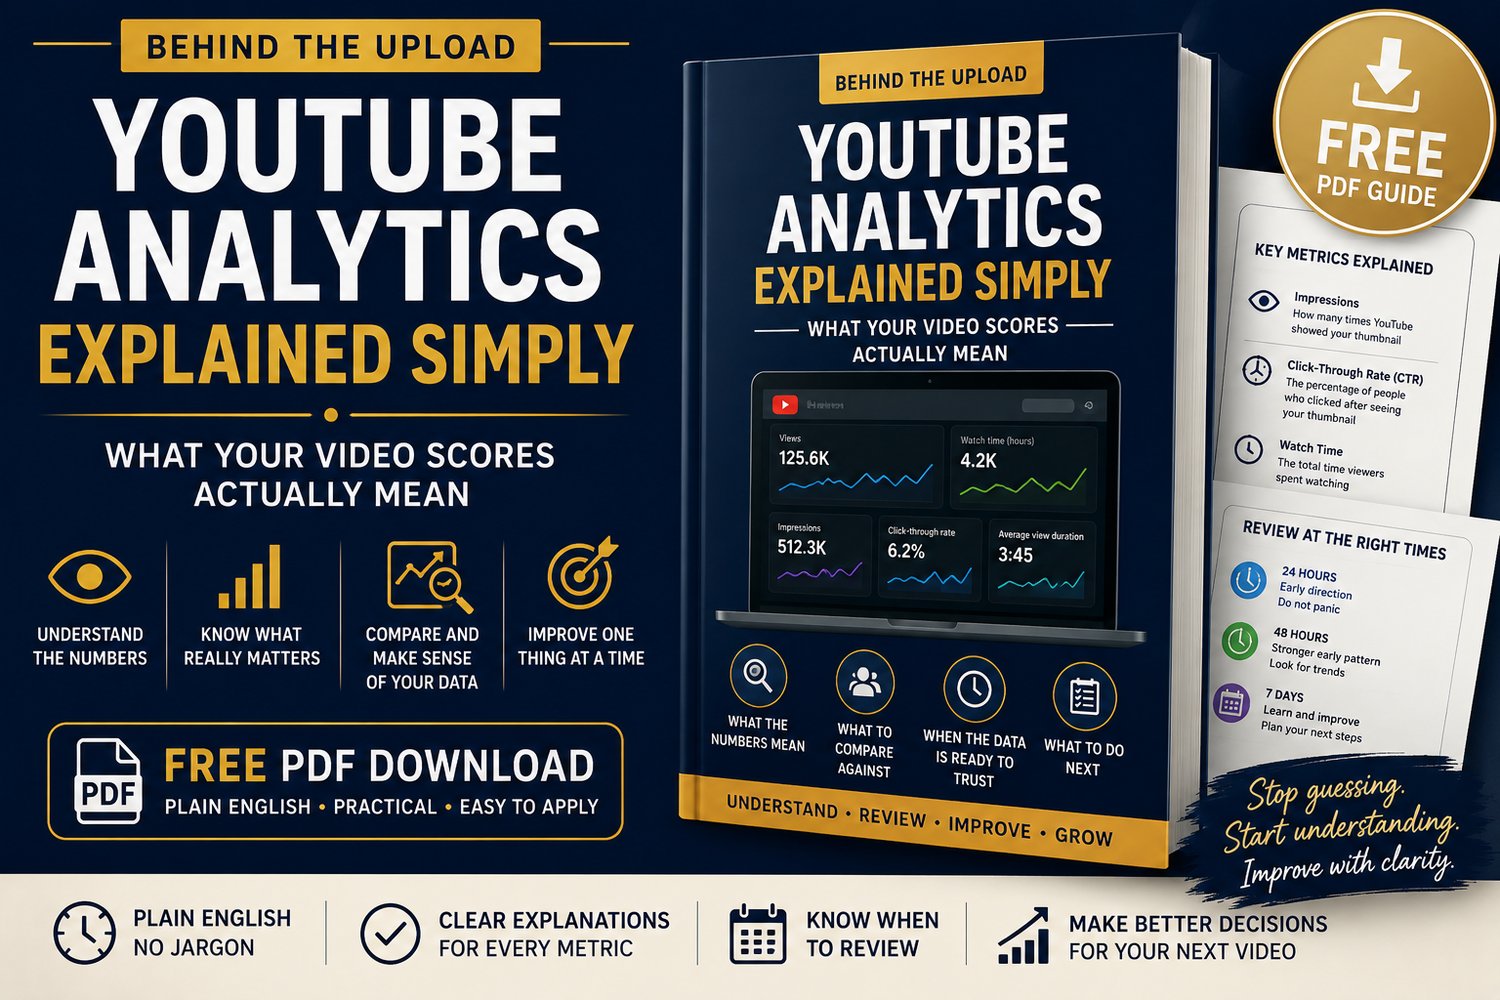
A free plain-English YouTube analytics guide for small creators who want to understand what their video scores are actually telling them.
YouTube Studio can feel overwhelming when you are faced with views, impressions, click-through rate, watch time, average view duration, retention, Browse traffic, Suggested traffic, subscribers, revenue, and revenue per 1,000 views.
This guide explains the main numbers simply.
Inside the PDF, you will learn:
- what impressions actually mean
- what click-through rate means
- why one number never tells the whole story
- what watch time and average view duration tell you
- how retention helps you understand where viewers stayed or left
- what Browse traffic and Suggested traffic mean
- what to compare your scores against
- when the data is too early to judge properly
- when to leave your title and thumbnail alone
- when a clear issue may need attention
- how to improve one thing at a time without panicking
The guide also includes a simple status system:
- Strong Signal
- Watch Carefully
- Not Ready Yet
- Action Required
This is not about obsessing over every number.
It is about understanding the bigger picture, reviewing your videos calmly, and making clearer decisions for your next upload.
No complicated analytics language.
No overnight promises.
No unnecessary admin.
Just a practical starting point for small creators who want to understand their YouTube channel properly.
Created by Behind The Upload.